Wednesday, December 21, 2016

2016 Greetings from IEEE Working Group on Energy Forecasting

Another Christmas is coming in few days. It's time to look back at 2016 and see what IEEE Working Group on Energy Forecasting has done:

Next year will be even more exciting:
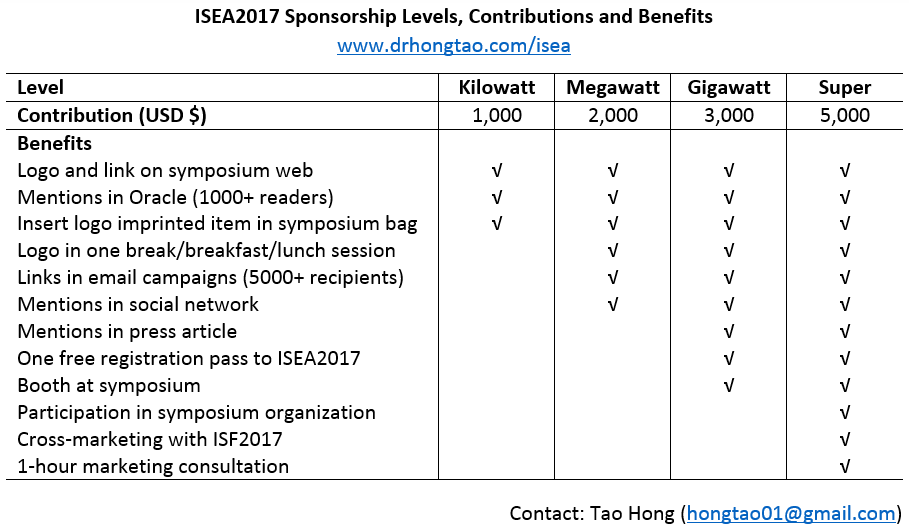
  • We will hold the International Symposium on Energy Analytics (ISEA2017), the first-ever gathering of world-wide energy forecasters in Cairns, Australia, the only place on earth with two World Heritage sites side-by-side, Great Barrier Reef and the Daintree Rainforest.  
  • We will conclude GEFCom2017 at ISEA2017 with the winner presentations and prizes. 
  • A PESGM2017 panel session on multiple energy systems is being organized by Ning Zhang and myself. 
  • I will be editing a special issue for the Power & Energy Magazine on big data analytics. The papers are by invitation only. If you have any good idea and would like to present it to thousands of PES members through this special issue, please let me know. 
  • We didn't have the bandwidth for JREF this year. We will try to conduct the JREF survey next year. 

Happy Holidays and Happy Forecasting!

Tuesday, December 20, 2016

Winning Methods from npower Forecasting Challenge 2016

RWE npower released the final leaderboard for its forecasting challenge 2016. I took a screen shot of the top teams. Interestingly, the international teams (colored in red) took over all of the top 6 places. Unfortunately, some of those top-notch UK load forecasters did not join the competition. I'm hoping that they can show up at the game to defend the country's legacy:)

RWE npower Forecasting Challenge 2016 Final Leaderboard (top 12 places)

In each of the previous two npower competitions, I asked my BigDEAL students to join the competition as a team. In both competitions, they were ranked top and beating all UK teams (see the blog posts HERE and HERE). We also published our winning methods for electricity demand forecasting and gas demand forecasting.

This year, instead of forming a BigDEAL team, I sent the students in my Energy Analytics class to the competition. The outcome is again very pleasing. The UNCC students took two of the top three places, and four of the top six places. What makes me, a professor, very happy is the fact that the research findings has been fully integrated into the teaching materials and smoothly transferred to the students in the class. (See my research-consulting-teaching circle HERE.)

OK, enough bragging...

I asked the top teams share their methodologies with the audience of my blog as what we did in BFCom2016s. Here they are:

Monday, November 28, 2016

7 Reasons to Send Your Best Papers to IJF

Last week, I was surfing the Web of Science to gather some papers to read during the holidays. Yes, some poor professors like myself work 24x7, including holidays. Suddenly I found that FIVE of my papers are listed by the Essential Science Index (ESI) as Highly Cited Papers. (Check them out HERE!) What a good surprise for Thanksgiving :)

What's even more surprising is that all of these five papers were published by the International Journal of Forecasting! As an editorial board member of two very prestigious and highly ranked journals, IEEE Transactions on Smart Grid (TSG) and International Joirnal of Forecasting (IJF), I send my best papers to these two journals every year, with an even split. So far, I've had six papers in TSG (not counting two editorials) and six in IJF. How come only my IJF papers were recognized by ESI?

The curiosity ate most of my Thanksgiving time. I was doing some research to answer this question, which eventually led to this blog post. In short,
you should send your best energy forecasting papers to IJF first!
Here is why:
  1. No page limit. IJF does not charge authors for extra pages. You can take as many pages as you like to elaborate your idea. The longest IJF paper I've read is Rafal Weron's 52-page review paper on price forecasting. My IJF review on probabilistic load forecasting is 25 pages long. Both reviews are now ESI Highly Cited Papers. 
  2. Short review time. A manuscript first reaches EIC, editor and then Associate Editor. It may be rejected by any of these three people. In other words, if it is a clear rejection, the decision would be coming to you rather quickly. If the manuscript is assigned to the reviewers, the first decision typically comes back within three to four months. 
  3. Very professional comments. I have seen many IJF review reports by far, as an author, reviewer and editor. Most of them are very professional. Eventually these review comments help the authors improve their work. I haven't seen any nonsense reviewer in the IJF peer-review system, which is quite remarkable! I guess the editors have done their job well by filtering out the nonsense reviewers before passing the comments to the authors. 
  4. High quality copy-editing service free of charge. Once the manuscript is accepted, it will be forwarded to a professional copy editor to polish the English for free, so you don't need to spend too much time with wordsmith. You don't need to worry about formatting either, because there is another copy editor doing that before the publisher sends you the proof. 
  5. Bi-annual awards. Every other year, IJF awards a prize for the best paper published in a two-year period. The prize is $1000 plus an engraved plaque. Details of the most recent one can be found HERE. Making some money and getting recognized for your paper, isn't it nice? 
  6. Publicity. Six years ago when I was pursuing my PhD, I was frustrated about the many useless papers in the literature. I brought my frustration to David Dickey. He made a comment that shocked me for a while. Instead of encouraging me to publish, he said that he had lost interest in publishing papers, because "the excellent papers are often buried by so many bad ones". Having been a professor for about three years, I have to agree with him. I believe in the era of "publish or perish", we have to "publish and publicize" to make our papers highly cited. Publishing your energy forecasting papers with IJF means that you get the opportunity of leveraging various channels, such as Hyndsight, Energy Forecasting, and the social media accounts of Elsevier and those renowned IJF editors. 
  7. "Business and economics" category in ESI. This is probably the most important distinction between IEEE Transactions and IJF. Many IEEE Transactions papers (including the ones in TSG) are grouped into engineering, while IJF papers are in the category of business and economics. The business and economics papers get much fewer citations on average than the engineering ones, which makes the ESI thresholds of business and economics lower than those of engineering. For instance, my TSG2014 paper is not an ESI paper, but it would have been if it were published by IJF. 
Unfortunately, IJF's acceptance rate is very low. To increase the chance to have the paper accepted, you should understand how reviewers evaluate the manuscript.

Look forward to your next submission!

Saturday, November 19, 2016

FAQ for GEFCom2017 Qualifying Match

I have received many questions from GEFCom2017 contestants. Many thanks to those who raised the questions. This is a list of frequently asked questions. I will update it periodically if I get additional ones.

Q1. I can't open the link to the competition data. How to get access to the data?

A1. If you cannot access the data via the provided link directly, you may need a VPN service. There are many free VPN services available. Use Google to find one, or post the question on LinkedIn forum to see if your peer contestants can help.

Q2. Can the competition organizer re-post the data somewhere else?

A2. No. We are not going to re-post the data during the competition, because ISO New England updates the data periodically.

Q3. Are we forecasting the same forecasting period in both Round 2 and Round 3? And another same forecasting period in both Round 4 and Round 5?

A3. For GEFCom2017-D, ISO New England updates the data every month, typically in the first half of the month. In Round 2, you will be using the data as of Nov 30, 2016. In Round 3, the December 2016 data should be available as well. For GEFCom2017-O, the data is being updated in real-time. We would like to see if there is any improvement with half a month of information. This set up also gives some flexibility to the contestants. If the team is busy with other commitments during the competition, they may submit the same forecast for both Round 2 and Round 3.

Q4. Can the same team join both tracks?

A4. Yes. A team may even submit the same forecasts to both tracks. Nevertheless, we are expecting higher accuracy in the forecasts of GEFCom2017-O than those of GEFCom2017-D.

Q5. Can one person join two or more teams?

A5. No.

Q6. I'm with a vendor. I don't know if my company wants to put its name as the team name. Can I join the competition personally? If I win, can I add my company as my affiliation and/or change the team name to my company's name?

A6. You can join the competition with or without linking your team to your company. However, you need to make the decision before registration. Once you are in the game, we can not change your affiliation or team name.

Q7. Which benchmark method will be used?

A7. The benchmark method forecasts each zone individually. We will use the vanilla model as the underlying model, simulate the temperature by shifting 11 years of temperature data (2005 - 2015) 4 days forward and backward to come up with 99 scenarios, which will be used to extract 9 quantiles. See THIS PAPER for more details.

Q8. In GEFCom2017-D, are we required to process daylight savings time in a specific way?

A8. No. You can treat the daylight savings time any way you like. THIS POST elaborates my approach, which you don't have to follow.

Q9. In GEFCom2017-D, are we allowed to assume the knowledge of federal holidays before 2011?Can we give special treatments to the days before and after the holidays?

A9. Yes, and yes. The opm.gov website only publishes federal holidays starting from 2011. You can infer the federal holidays before 2011. You can model the days before and after holidays the way you like. I had a holiday effect section in my dissertation, which you don't have to follow. Keep in mind that you should not assume any knowledge about local events or local holidays, such as NBA final games and Saint Patrick's Day.

Q10. The sum of the 8 zones are slightly different from the total demand published by ISO New England. Which number will you use to evaluate the total demand?

A10. Column D of the "ISO NE CA" worksheet.

Q11. For GEFCom2017-D, are you going to provide weather forecasts that every team should use?

A11. No. It is an ex ante hierarchical probabilistic load forecasting problem. We do not provide weather forecasts. The contestants in the GEFCom2017-D track should not use any weather forecasts from other data sources. Nevertheless, the contestants may generate their own weather forecast if they want to. The weather forecasting methodology should be in the final report if they take this route.

Q12. No wind, solar or price forecasting in GEFCom2017? It's a pity!

A12. GEFCom2017 is a load forecasting competition. Unfortunately, we were not able to identify good datasets to set up wind, solar or price forecasting tracks to match the challenge level as this load forecasting problem. Nevertheless, in GEFCom2017-O, you may leverage other data sources to predict wind, solar and prices, which may be good for your load forecasts.

Q13. I'm a professor. Any advice if I want to leverage this competition in class?

A13. It would be nice to leverage the competition in your course. I did so two years ago in GEFCom2014. There will again be an institute prize in GEFCom2017. To aim for the institute prize, I would recommend that you sign up as many teams as possible to maximize the likelihood to win. What I did two years ago was to have each student form a single-person team, and tied the competition ranking to their grades. Anyway, if you are going to join the competition, it's better to have the students look into the data ASAP. The first round submission is due on 12/15/2016.

Q14. Any reference materials we should read before we dive into the competition problem?

A14. For probabilistic load forecasting, you should at least read this recent IJF review paper on probabilistic load forecasting and the relevant references. You can find my recent papers on probabilistic load forecasting HERE. The papers from winning entries of GEFCom2014 are HERE. For hierarchical forecasting, you can check out Hyndman and Athanasopoulos' BOOK and their PAPER

Saturday, October 29, 2016

Instructions for GEFCom2017 Qualifying Match

The GEFCom2017 Qualifying Match means to attract and educate a large number of contestants with diverse background, and to prepare them for the final match. It includes two tracks: a defined-data track (GEFCom2017-D) and an open-data track (GEFCom2017-O). In both tracks, the contestants are asked to forecast the same thing: zonal and total loads of ISO New England. The only difference between the two tracks is on the input data.

Data 

The input data a participating team can use GEFCom2017-D should not go beyond the following:
  1. Columns A, B, D, M and N in the worksheets of "YYYY SMD Hourly Data" files, where YYYY represents the year. These data files can be downloaded from ISO New England website via the zonal information page of the energy, load and demand reports. Contestants outside United States may need a VPN to access the data. 
  2. US Federal Holidays as published via US Office of Personnel Management.
The contestants are assumed to have the general knowledge of Daylight Savings Time and inferring the day of week and month of year based on a date.

There is no limitation for the input data in GEFCom2017-O.

Forecasts

The forecasts should be in the form of 9 quantiles following the exact format provided in the template file. The quantiles are the 10th, 20th, ... 90th percentiles. The forecasts should be generated for 10 zones, including the 8 ISO New England zones, the Massachusetts (sum of three zones under Massachusetts), and the total (sum of the first 8 zones).

Timeline

GEFCom2017 Qualifying Match includes six rounds.

Round 1 due date: Dec 15, 2016; forecast period: Jan 1-31, 2017.
Round 2 due date: Dec 31, 2016; forecast period: Feb 1-28, 2017.
Round 3 due date: Jan 15, 2017; forecast period: Feb 1-28, 2017.
Round 4 due date: Jan 31, 2017; forecast period: Mar 1-31, 2017.
Round 5 due date: Feb 14, 2017; forecast period: Mar 1-31, 2017.
Round 6 due date: Feb 28, 2017; forecast period: Apr 1-30, 2017.
Report and code due date: Mar 10, 2017.

The deadline for each round is 11:59pm EST of the corresponding due date.

Submission

The submissions will be through email. Within two weeks of registration, the team leader should receive a confirmation email with the track name and team name in the email subject line. If the team registered both tracks, the team leader should receive two separate emails, one for each track.

The team lead should submit the forecast on behalf of the team by replying to the confirmation email.

The submission must be received before the deadline (based on the receipt time of the email system) to be counted in the leaderboard.

Template

The submissions should strictly follow the requirements below:
  1. The file format should be *.xls;
  2. The file name should be "TrackInitialRoundNumber-TeamName". For instance, Team "An Awesome Win" in the defined data track's round 3 should name the file as "D3-An Awesome Win".
  3. The file should include 10 worksheets, named as CT, ME, NEMASSBOST, NH, RI, SEMASS, VT, WCMASS, MASS, TOTAL. Please arrange the worksheets in the same order as listed above. 
  4. In each worksheet, the first two columns should be date and hour, respectively, in chronological order.
  5. The 3rdto the 11th columns should be Q10, Q20, ... to Q90. 
The template is HERE. The contestants should replace the date column to reflect the forecast period in each round.

Evaluation

In round i, for a forecast submitted by team j for zone k, the average Pinball Loss of the 9 quantiles will be used as the quantile score of the probabilistic forecast Sijk. A benchmark method will be used to forecast each of the 10 zones. We denote the quantile score of the benchmark method in round i for zone k as Bik.

In round i, we will calculate the relative improvement (1 - Sijk/Bik) for each zone. The average improvement over all zones team j accomplishes will be the rating for team j, denoted as Rij. The rank of team j in round i is RANKij.

The weighted average of the rankings from all 6 rounds will be used to rank the teams in the qualifying match leaderboard. The first 5 rounds will be weighted equally, while the weight for the 6th round is doubled.

A team completing four or more rounds is eligible to for the prizes. The ratings for the missing rounds will be imputed before calculating the weighted average of the ratings.

Prizes

Institute Prize (up to 3 universities): $1000
1st place in each track: $2000
2nd place in each track: $1000
3rd place in each track: $500
1st place in each round of each track: $200

For more information about GEFCom2017, please visit www.gefcom.org.

Friday, October 14, 2016

GEFCom2017: Hierarchical Probabilistic Load Forecasting

IEEE Working Group on Energy Forecasting invites you to join the Global Energy Forecasting Competition 2017 (GEFCom2017): Hierarchical Probabilistic Load Forecasting.

Background

Emerging technologies, such as microgrids, electric vehicles, rooftop solar panels and intelligent batteries, are challenging the traditional operational practices of the power industry. While uncertainties on the demand side are pushing the operational excellence toward the edge of the grid, probabilistic load forecasting at various levels of the power system hierarchy is becoming increasingly important.

GEFCom2017 will bring together state-of-the-art techniques and methodologies for hierarchical probabilistic energy forecasting. The competition features a bi-level setup: a three-month qualifying match that includes two tracks, and a one-month final match on a large-scale problem.

Qualifying match

The qualifying match means to attract and educate a large number of contestants with diverse background, and to prepare them for the final match. The qualifying match includes two tracks, both on forecasting the zonal and total loads of ISO New England (the "DEMAND" column) for the next month in real-time on rolling basis.

The defined-data track (GEFCom2017-D) restricts the data used by the contestants. The data cannot go beyond the calendar data, load (the "DEMAND" column) and temperature data (the "DryBulb" and "DewPnt" columns) provided by ISO New England via the zonal information page of the energy, load and demand reports,  plus the US Federal Holidays as published via US Office of Personnel Management. The contestants may infer day of week and Federal Holidays based on the aforementioned data.

The open-data track (GEFCom2017-O)encourages the contestants to explore various public and private data sources and bring the necessary data into the load forecasting process. The data may include, but is not limited to the data published by ISO New England, the weather forecast data from any weather service providers, the local economy information, the penetration of solar PV published by US government websites.

Final match

The final match (GEFCom2017-F) will be open to the top entries from the qualifying match, tackling a more challenging, larger scale problem than the qualifying match problems. The final match includes one-track only, forecasting the load of a few hundred delivery points of a U.S. utility. The data is from the real world, so the contestants should expect many data issues, such as load transfers and anomalies. Details of the final match will be released on March 15, 2017.

Submission method

To save competition platform costs and implement more sophisticated evaluation methods, the submission will be via email. Within two weeks of the registration, the contestants will receive an email with the instructions about how to submit the forecasts.

Evaluation 

The "DEMAND" column published by ISO New England will be used to evaluate the skills of the probabilistic forecasts. Note that the "DEMAND" data may be revised during the settlement process. The version at the time of evaluation will be used to score the forecasts.

The evaluation metric is quantile score. For each forecasted period, the quantile score of a submitted forecast will be compared with the quantile score of the benchmark. The relative improvement over the benchmark will be used to rate and rank the teams.

World Energy Forecaster Rankings (WEFR)

Many contestants who joined GEFCom2012 also participated in GEFCom2014. To encourage the continuous investments in energy forecasting and recognize those who excel in these competitions, we will start building the World Energy Forecaster Rankings.

The contestants of GEFCom2017 will be eligible to participate in WEFR. We hope the rankings can help reward the participants with career opportunities and tickets to future competitions. In addition, editors of relevant journals can also leverage WEFR to enhance the peer review process.

Prize

IEEE Power and Energy Society budgeted 20,000 for this competition. The prize pool is $18,000, to be shared among the winning teams and institutions from qualifying match and final match.

Publication

Winning teams will be invited to submit papers to a special issue of the International Journal of Forecasting. 

Registration

The maximum team size is three. The team leader should register on behalf of the team. The registration period is from Oct 14, 2016 to Jan 14, 2017. Please register via THIS LINK if you want to join the competition.

Competition timeline
  • Competition Problems Release  --  Oct 14, 2016
  • Qualifying Match Starts  --  Dec 1, 2016
  • Qualifying Match Ends  --  Feb 28, 2017
  • Final Match Data Release  --  Mar 15, 2017
  • Final Match Submission Due  --  May 15, 2017

Additional rules

For any questions or comments, please put them in the comment field below. Please link your name to your LinkedIn profile. 

Thursday, October 13, 2016

Congratulations, Dr. Jingrui Xie!

Today (October 13, 2016), Jingrui (Rain) Xie defended her doctoral dissertation on probabilistic electric load forecasting, which made her the first BigDEAL PhD.

When coming back to academia three years ago, I had the mission of producing the next generation of finest analysts for the industry. As the first PhD from BigDEAL, Rain sets the standard for BigDEAL products and tells what the finest analyst looks like.

Rain joined UNC Charlotte in August, 2013, as my first master student. She received her M.S. degree in Engineering Management in May, 2015, and continued with her PhD in Infrastructure and Environmental Systems.

In just three years, she published 7 journal papers:
  • Temperature scenario generation for probabilistic load forecasting (TSG, in press)
  • Relative humidity for load forecasting models (TSG, in press)
  • On normality assumption in residual simulation for probabilistic load forecasting (TSG, 2016)
  • GEFCom2014 probabilistic electric load forecasting: an integrated solution with forecast combination and residual simulation (IJF, 2016)
  • Improving gas load forecasts with big data (GAS, 2016)
  • Long term retail energy forecasting with consideration of residential customer attrition (TSG, 2015)
  • Long term probabilistic load forecasting and normalization with hourly information (TSG, 2014)
and 3 conference papers:
  • Comparing two model selection frameworks for probabilistic load forecasting (PMAPS, 2016)
  • From high-resolution data to high-resolution probabilistic load forecasts (T&D, 2016)
  • Combining load forecasts from independent experts: experience at NPower forecasting challenge 2015 (NAPS, 2015)
She was among the top contestants in all of the forecasting competitions she participated:
  • Top1 in BigDEAL Forecasting Competition 2016
  • Top 3 in NPower Gas Demand Forecasting Challenge 2015
  • Top 3 in NPower Electricity Demand Forecasting Challenge 2015
  • Top 3 in Load Forecasting Track of Global Energy Forecasting Competition 2014
She has also received several prestigious awards:
  • 2016 IEEE PES Technical Committee Prize Paper Award
  • International Symposium on Forecasting 2016 Travel Award
  • 2015 IEEE Transactions on Smart Grid Best Reviewer Award
  • 2015 Foundation of the Association of Energy Engineers Scholarship
  • International Symposium on Forecasting 2015 Travel Award
  • 2015 UNCC College of Engineering Outstanding Graduate Research Assistant Award
  • 2015 International Institute of Forecasters Student Forecasting Award
Rain has been full-time working at SAS during the past three years. In addition to the academic excellence, Rain received a promotion earlier this year for her outstanding performance at work

It took her 21 months to get the PhD - she enrolled in the PhD program in January, 2015, and defended the dissertation today. That said, she just proved the reproducibility of my 20-month PhD!

Lastly, but most importantly, she became a mother two years ago - her daughter is now two-year old. 

Again, congratulations, Dr. Jingrui Xie!

Wednesday, October 5, 2016

NPower Forecasting Challenge 2016

RWE npower is running its forecasting challenge again this year. The purpose is to recruit summer interns from UK schools. Nevertheless, the competition will be open to people outside UK as well.

In 2015, BigDEAL participated in both competitions, one on electric load forecasting, and the other on gas load forecasting. We summarized our methods into two papers (electricity; gas), which may give you some idea about the previous competitions.

The registrations are now open until November 1, 2016. Have fun!

Thursday, September 22, 2016

A Five-minute Introduction to Electric Load Forecasting

I was recently interviewed by Prof. Galit Shmueli for her recently launched free online course Business Analytics Using Forecasting. In this interview, I gave a 5 minutes introduction to electric load forecasting, discussing the special characteristics of load forecasting and what is needed for successful solutions.


Monday, September 19, 2016

Announcing GEFCom2017: Join the Interest List

I'm sure readers of this blog are anxious for the next Global Energy Forecasting Competition. Today I'm pleased to announce the GEFCom2017, an upgraded version over GEFCom2012 and GEFCom2014.

To bring together contestants with diverse background and to dive deep into the challenging problems, GEFCom2017 will feature a bi-level setup: a three-month qualifying match and a one-month final match. The qualifying match means to attract and educate a large number of contestants with diverse background. The final match will be open to the top entries from the qualifying match, tackling a more challenging, larger scale problem.

Many contestants who joined GEFCom2012 also participated in GEFCom2014. To encourage the continuous investments in energy forecasting and recognize those who excel in these competitions, we will start building the World Energy Forecaster Rankings.

We will release the competition problems and the formal registration on 10/14/2016. Please join the interest list HERE to get timely updates about GEFCom2017.

Stay tuned!

Sunday, September 11, 2016

Call For Sponsors: 2017 International Symposium on Energy Analytics (ISEA2017)

The first International Symposium on Energy Analytics (ISEA2017) will be held in Cairns, Australia, June 22-23, 2017. Cairns is the only place in the world where two World Heritage listed areas are side-by-side: The Great Barrier Reef and The Daintree Rainforest, For more information about Cairns, please visit the Cairns visitors information guide.

ISEA2017 features the theme "Predictive Energy Analytics in the Big Data World". The topics of interest can be found HERE. We expect about 50 attendees, 1/3 from academia and 2/3 from the industry. ISEA2017 is right before the 37th International Symposium on Forecasting (ISF2017), the flagship conference of the International Institute of Forecasters (IIF). Attendees of ISEA2017 will also get a discounted registration to ISF2017.

IIF is a major sponsor of ISEA2017. We are also looking for additional sponsors to keep the cost down for attendees. The sponsor information is highly visible at ISEA2017 and its website, as well as through the email and social media campaigns. This is a great opportunity to support the energy forecasting community, promote your organization and show off your products and services. For your energy analysts, this symposium would be a great venue to learn from and network with peers from other organizations.

The sponsorship can be on any of the four levels as listed below. If you are interested in sponsoring the event, please contact me via email: hongtao01 AT gmail DOT com.


Wednesday, August 24, 2016

Guest Editorial: Big Data Analytics for Grid Modernization

IEEE Transactions on Smart Grid just published our special section on Big Data Analytics for Grid Modernization. The guest editorial is on IEEE Xplore with open access. The original Call for Papers is HERE.

While "big data" is quickly becoming a buzz word (see THIS POST), in this guest editorial we discussed our interpretation from four aspects:
  1. The data involved in the analysis is big in at least one of its three defining dimensions: volume, variety or velocity. The big data used in the utility industry includes but is not limited to smart meter data, phasor measurement unit data, weather data, and social media data. 
  2. The problem under investigation is to prepare for analyzing the big data, such as data compression and data security issues. 
  3. The methodology requires customized modeling of individual components of a system, or leads to in-depth understanding of the individual components. For instance, estimating the invisible solar generation belongs to this category. 
  4. The technology can be used to help reach the answer faster, or answer the questions otherwise difficult to answer. For example, a distributed platform can be used to speed up the analytic tasks.
Thanks to the diligent work from our guest editors, reviewers and the authors, we are able to present a high-quality collection of papers to the community. Below is the list of 17 special section papers:
  1. D. Zhou, J. Guo, Y. Zhang, J. Chai, H. Liu, Y. Liu, C. Huang, X. Gui and Y. Liu, "Distributed Data Analytics Platform for Wide-Area Synchrophasor Measurement Systems," IEEE Transactions on Smart Grid, vol. 7, no. 5, pp. 2397-2405, Sept. 2016
  2. P. H. Gadde, M. Biswal, S. Brahma and H. Cao, "Efficient Compression of PMU Data in WAMS," IEEE Transactions on Smart Grid, vol. 7, no. 5, pp. 2406-2413, Sept. 2016
  3. X. Tong, C. Kang and Q. Xia, "Smart Metering Load Data Compression Based on Load Feature Identification," IEEE Transactions on Smart Grid, vol. 7, no. 5, pp. 2414-2422, Sept. 2016
  4. J. Hu and A. V. Vasilakos, "Energy Big Data Analytics and Security: Challenges and Opportunities," IEEE Transactions on Smart Grid, vol. 7, no. 5, pp. 2423-2436, Sept. 2016
  5. Y. Wang, Q. Chen, C. Kang and Q. Xia, "Clustering of Electricity Consumption Behavior Dynamics Toward Big Data Applications," IEEE Transactions on Smart Grid, vol. 7, no. 5, pp. 2437-2447, Sept. 2016
  6. S. Ben Taieb, R. Huser, R. J. Hyndman and M. G. Genton, "Forecasting Uncertainty in Electricity Smart Meter Data by Boosting Additive Quantile Regression," IEEE Transactions on Smart Grid, vol. 7, no. 5, pp. 2448-2455, Sept. 2016
  7. H. Shaker, H. Zareipour and D. Wood, "Estimating Power Generation of Invisible Solar Sites Using Publicly Available Data," IEEE Transactions on Smart Grid, vol. 7, no. 5, pp. 2456-2465, Sept. 2016
  8. H. Shaker, H. Zareipour and D. Wood, "A Data-Driven Approach for Estimating the Power Generation of Invisible Solar Sites," IEEE Transactions on Smart Grid, vol. 7, no. 5, pp. 2466-2476, Sept. 2016
  9. X. Zhang and S. Grijalva, "A Data-Driven Approach for Detection and Estimation of Residential PV Installations," IEEE Transactions on Smart Grid, vol. 7, no. 5, pp. 2477-2485, Sept. 2016
  10. H. Wang and J. Huang, "Cooperative Planning of Renewable Generations for Interconnected Microgrids," IEEE Transactions on Smart Grid, vol. 7, no. 5, pp. 2486-2496, Sept. 2016
  11. J. Peppanen, M. J. Reno, R. J. Broderick and S. Grijalva, "Distribution System Model Calibration With Big Data From AMI and PV Inverters," IEEE Transactions on Smart Grid, vol. 7, no. 5, pp. 2497-2506, Sept. 2016
  12. Y. C. Chen, J. Wang, A. D. Domínguez-García and P. W. Sauer, "Measurement-Based Estimation of the Power Flow Jacobian Matrix," IEEE Transactions on Smart Grid, vol. 7, no. 5, pp. 2507-2515, Sept. 2016
  13. H. Sun, Z. Wang, J. Wang, Z. Huang, N. Carrington and J. Liao, "Data-Driven Power Outage Detection by Social Sensors," IEEE Transactions on Smart Grid, vol. 7, no. 5, pp. 2516-2524, Sept. 2016
  14. H. Jiang, X. Dai, D. W. Gao, J. J. Zhang, Y. Zhang and E. Muljadi, "Spatial-Temporal Synchrophasor Data Characterization and Analytics in Smart Grid Fault Detection, Identification, and Impact Causal Analysis," IEEE Transactions on Smart Grid, vol. 7, no. 5, pp. 2525-2536, Sept. 2016
  15. M. Rafferty, X. Liu, D. M. Laverty and S. McLoone, "Real-Time Multiple Event Detection and Classification Using Moving Window PCA," IEEE Transactions on Smart Grid, vol. 7, no. 5, pp. 2537-2548, Sept. 2016
  16. T. Jiang, Y. Mu, H. Jia, N. Lu, H. Yuan, J. Yan and W. Li, "A Novel Dominant Mode Estimation Method for Analyzing Inter-Area Oscillation in China Southern Power Grid," IEEE Transactions on Smart Grid, vol. 7, no. 5, pp. 2549-2560, Sept. 2016
  17. B. Wang, B. Fang, Y. Wang, H. Liu and Y. Liu, "Power System Transient Stability Assessment Based on Big Data and the Core Vector Machine," IEEE Transactions on Smart Grid, vol. 7, no. 5, pp. 2561-2570, Sept. 2016

Citation

Tao Hong, Chen Chen, Jianwei Huang, Ning Lu, Le Xie and Hamidreza Zareipour, "Guest Editorial: big data analytics for grid modernization", IEEE Transactions on Smart Grid, vol.7, no.5, pp 2395-2396, September, 2016

Guest Editorial: Big Data Analytics for Grid Modernization

Tao Hong, Chen Chen, Jianwei Huang, Ning Lu, Le Xie and Hamidreza Zareipour

Saturday, July 30, 2016

Southwest Forecasting and Customer Analytics Forum 2016

Southwest Forecasting and Customer Analytics Forum 

Hosted By Tucson Electric Power, September 15-16, 2016

Tucson Electric Power is pleased to host the Southwest Forecasting and Customer Analytics Conference for the utility industry at its downtown Tucson headquarters.  Topics and events covered in the program:
  • Perspective on Using Forecasts by David G. Hutchens, President and CEO, TEP and its parent company, UNS Energy Corporation
  • The Evolving Regulated Utility Industry – Prof. Stanley Reynolds, University of Arizona
  • Energy Forecasting: Past, Present, and Future – Prof. Tao Hong, UNC at Charlotte
  • How Will Battery Storage Deployment Affect Load Forecasting? – Jason Burwen, ESA
  • Impact and Value of Plug-in Electric Vehicle Load & Managed Charging – R. Graham, U.S. Energy Department and Dr. Hongyan Sheng, Southern California Edison
  • Location-Specific Probabilistic Forecasting and Planning Methods – Josh Bode, Nexant
  • Home Appliances: Historical Declines in Energy Use, Future Potential Savings, and an Update on Efficiency Standards – Joanna Mauer, Appliance Standards Awareness Project
  • Likelihood of Customer Participation in Utility Programs – Dr. Erin Boyd, Pacific Gas & Electric
  • Networking Dinner
The only cost of this program is your own travel to Tucson, Arizona and the cost of dinner.  For details, see the program HERE.

Tuesday, July 26, 2016

Temperature Scenario Generation for Probabilistic Load Forecasting

When using weather scenarios to generate probabilistic load forecasts, a frequently asked question is
How many years of weather history do we need? 
This paper gives an answer based on an empirical study.

Most of my papers were accepted after two or more revisions. This time it only took one revision to have this paper accepted. In the first round of review, We received 40 comments from 6 reviewers. Our first revision was accepted after 4 of the reviewers recommended acceptance. In this blog post, I'm attaching the submitted version of the revision including our response letter. Some of our responses were rebuttals to one of the reviewers who made a personal attack on me.

Citation

Jingrui Xie and Tao Hong, "Temperature scenario generation for probabilistic load forecasting", Transactions on Smart Grid, accepted.

The working paper is available HERE.

Temperature Scenario Generation for Probabilistic Load Forecasting

Jingrui Xie and Tao Hong

Abstract

In today’s dynamic and competitive business environment, probabilistic load forecasting (PLF) is becoming increasingly important to utilities for quantifying the uncertainties in the future. Among the various approaches to generating probabilistic load forecasts, feeding simulated weather scenarios to a point load forecasting model is being commonly accepted by the industry for its simplicity and interpretability. There are three practical and widely used methods for temperature scenario generation, namely fixed-date, shifted-date, and bootstrap methods. Nevertheless, these methods have been used mainly on ad hoc basis without being formally compared or quantitatively evaluated. For instance, it has never been clear to the industry how many years of weather history is sufficient to adopt these methods. This is the first study to quantitatively evaluate these three temperature scenario generation methods based on the quantile score, a comprehensive error measure for probabilistic forecasts. Through a series of empirical studies on both linear and nonlinear models with three different levels of predictive power, we find that 1) the quantile score of each method shows diminishing improvement as the length of available temperature history increases; 2) while shifting dates can compensate short weather history, the quantile score improvement gained from the shifted-date method diminishes and eventually becomes negative as the number of shifted days increases; and 3) comparing with the fixed-date method, the bootstrap method offers the capability of generating more comprehensive scenarios but does not improve the quantile score. At the end, an empirical formula for selecting and applying the temperature scenario generation methods is proposed together with a practical guideline.  

Thursday, July 7, 2016

GEFCom2012 Load Forecasting Data

The load forecasting track of GEFCom2012 was about hierarchical load forecasting. We asked the contestants to forecast and backcast (check out THIS POST for the definitions of forecasting and backcasting) the electricity demand for 21 zones, of which the Zone 21 was the sum of the other 20 zones.

Where to download the data?

You can also download an incomplete dataset from Kaggle, which does not have the solution data. The complete data was published as the appendix of our GEFCom2012 paper. If you don't have access to Science Direct, you can downloaded from my Dropbox link HERE. Regardless where you get the data, you should cite this paper to acknowledge the source:
  • Tao Hong, Pierre Pinson and Shu Fan, "Global energy forecasting competition 2012", International Journal of Forecasting, vol.30, no.2, pp 357-363, April-June, 2014. 

What's in the package?

Unzip the file, and navigate to "GEFCOM2012_Data\Load\" folder, you will see 6 files:
  • load_history
  • temperature_history
  • holiday_list
  • load_benchmark
  • load_solution
  • temperature_solution
Our GEFCom2012 paper has introduced the first five datasets but not the last one. The "temperature_solution" dataset includes the temperature data from 2008/6/30 7:00 to 2008/7/7 24:00, while the "load_solution" dataset does not include the load data from 2008/6/30 7:00 to 2008/6/30 24:00.

What's not working?

Before using the data, please understand that
there is no way to restore the exact Kaggle setup for you to make direct comparison on the error score. 
The main reason is that Kaggle pick a random subset of the solution data to calculate the scores for public leaderboard, and the rest for private leaderboard. We do not know which data was used for which leaderboard.

Nevertheless, it was never our intention to let you make comparisons in a Kaggle way. It is because the GEFCom2012 was set up more like a data mining competition than a forecasting competition. The contestants can submit their forecasts many times, while Kaggle was picking the best score. This is not a realistic forecasting process.

How to use the data?

Instead, we encourage you to use these 4.5 years of hourly data without considering the Kaggle setup. You can even keep 4 full calendar years and get rid of the last half a year in your case studies. With four years of data, you can perform one-year ahead ex post forecasting (see my weather station selection paper). You can also perform short term ex post forecasting on rolling basis (see my recency effect paper).

Then the question is whether the accuracy is "good enough". According to Table 3 of our GEFCom2012 paper, the winning teams improved the benchmark by about 30% - see the "test" column, which is the private leaderboard of Kaggle. In other words, if your model is getting about 30% error reduction comparing to the Vanilla benchmark on this dataset, it is a decent model.

Please also understand that this 30% is gained from a forecasting system with many bells and whistles, such as detailed modeling of temperature, and special treatment of holidays. If your research is focus on one components, the error reduction may be much smaller than 30%. You can find a more detailed arguments in my response to the second review comment in THIS POST.

It's been over two years since we published the GEFCom2012 data. Many researchers have already used it to test their models. You can also replicate the experiment setup in the recently published papers that used this GEFCom2012 data, and compare your results with the results on those papers.

Back to Datasets for Energy Forecasting.

Saturday, July 2, 2016

Datasets for Energy Forecasting

Reproducible research is a key to advancing knowledge. In energy forecasting, it is necessary and crucial that researchers compare their models and methods using the same datasets. Five years ago when we founded the IEEE Working Group on Energy Forecasting, "lack of benchmark data pool" was one of the issues we identified. Fortunately, things have been changing toward the right direction over the past few years. More and more datasets are being made available to and recognized by the energy forecasting community.

This post will serve as the starting point of a blog series on datasets. In each post, I will feature a dataset and discuss how to use it. I will also host the datasets on Dropbox and provide the links in these posts. Meanwhile, I would like to take a crowd-sourcing approach to making a comprehensive and widely accessible data pool:
  • If you can host the datasets through other channels, please contact me. 
  • If you know of some public datasets that are not on my list, please contact me. 
  • If you have some private datasets that can be made available to the energy forecasting community, please contact me. 
Here is a list of 9 posts with the publicly available data that I have used in my papers. I will update the list with links and additional data sources, so check this page from time to time to see if there is something you need.

Electric load forecasting
  1. GEFCom2012
  2. GEFCom2014
  3. ISO New England
  4. RWE npower forecasting challenge 2015
Gas load forecasting
  1. RWE npower forecasting challenge 2015
Electricity price forecasting
  1. GEFCom2014
Wind power forecasting
  1. GEFCom2012
  2. GEFCom2014
Solar power forecasting
  1. GEFCom2014
Stay tuned...

Saturday, May 21, 2016

Call For Papers: 2017 International Symposium on Energy Analytics (ISEA2017)

2017 International Symposium on Energy Analytics
(ISEA2017)
Cairns, Australia, June 22-23, 2017
Predictive Energy Analytics in the Big Data World


Modern information and communication technologies have brought big data to virtually every segment of the energy and utility industries. While predictive analytics is an important and necessary step in the data-driven decision-making process, how to generate better forecasts in the big data world is an emerging issue and challenge to both industry and academia.

This symposium aims at bringing forecasting experts and practitioners together to share experiences and best practices on a wide range of important business problems in the energy industry. Here the energy industry broadly covers utilities, oil, gas and mining industries. The subjects to be forecasted range from supply, demand and price, to asset/system condition and customer count.

The topics of interest include but are not limited to:
  • Probabilistic energy forecasting
  • Hierarchical energy forecasting
  • High-dimensional energy forecasting
  • High-frequency and high-resolution energy forecasting
  • Equipment failure prediction
  • Power systems fault prediction
  • Automatic outlier detection
  • Load profiling
  • Customer segmentation
  • Customer churn prediction
If you are interested in contributing a presentation to this symposium, please submit a one-page extended abstract to both guest editors via email with the subject line “ISEA2017 Abstract Submission”. Authors of selected abstracts will be invited to submit full papers to the International Journal of Forecasting (IJF) or Power and Energy Magazine.

Important ISEA2017 dates
  • Abstract submission open - November 15, 2016
  • Abstract submission due - January 15, 2017
  • Abstract acceptance - February 15, 2017
  • Early registration deadline - April 14, 2017
  • ISEA2017 - June 22-23, 2017
  • ISF2017 - June 25-28, 2017
  • Paper submission for consideration of journal/magazine publication - June 30, 2017
Important publication dates
  • First round review completion - August 31, 2017
  • Final version ready for Power and Energy Magazine - October 31, 2017
  • Final version ready for IJF - December 31, 2017
  • Power and Energy Magazine special issue publication - May/June, 2018
  • IJF special section publication - 2018

Guest Editors:
Tao Hong, University of North Carolina at Charlotte, USA (hong@uncc.edu)
Pierre Pinson, Technical University of Denmark, Denmark (ppin@elektro.dtu.dk)

Editor-in-Chief
Rob J Hyndman, Monash University, Australia
International Journal of Forecasting

Thursday, May 19, 2016

Job Openings for Energy Analysts and Forecasters

[Update: I've created a page for jobs, so that it is easy for the readers to find those positions. Check them out HERE.]

During the past two years or so, the largest tag in this blog has been "jobs". From February 2013 to February 2015, I posted 56 jobs. Due to the increased demand for energy forecasters, I can no longer respond to the job posting requests in time. Therefore, I have decided to take a new approach to job posting.

You are invited to post your job openings using the Name/URL option in the comments field. Please be brief about your job postings. Rather than pasting the whole job description, I would recommend you just listing the job title, company and a link to the job description or application site. In addition, you can also provide your contact information for the readers to contact you if you are the hiring manager or recruiter. I will moderate the comment field.

I'm posting the BigDEAL recruiting message first as an example.

Happy recruiting and job hunting!

Wednesday, May 18, 2016

My Path to Forecasting

The International Institute of Forecasters posted my profile this week.

How did you become a forecaster?

My path to forecasting was more like a maze than a straight line.

In 2005, I joined North Carolina State University’s Electrical Engineering doctoral program. Halfway through my PhD study, in January 2008, I started working in a consulting firm as an electrical engineer, providing services to the energy and utility industries. My first project was on long term spatial load forecasting – forecasting the 30-year ahead annual peak demand for each 50-acre small area of a US utility. In today’s terminology, it is a hierarchical forecasting problem. Knowing almost nothing about forecasting at that time, I formulated the problem as an optimization problem: minimizing the errors in the historical fit and the discrepancies between the sum of lower level forecasts and the upper level forecast, subject to some constraints on saturation load level and load growth rate, etc. I wrote thousands of lines of code in VBA to solve it. I also developed a user interface in MS Excel for power system planners to override the parameters estimated by the computer and see the results on a map. Finally, the solution was very well received by the customer and then sold to many other customers. I also packaged the work into a thesis when I got my master’s degree in operations research and industrial engineering.

At the end of 2008, I was tasked with forecasting hourly electricity demand for another US utility. It was a competition – if my forecast won, the customer would give us a big contract. While the spatial load forecasting project did not require a rigorous evaluation based on the forecast accuracy, this one did. I knew I couldn’t win without getting some statistical forecasting skills. With the help from my wife, a forecaster working at SAS, we developed a linear model that eventually led to a big consulting contract to develop a short term load forecasting solution. In 2009, I joined the Operations Research PhD program of NC State while developing and delivering that short term load forecasting solution at work. I took some time series forecasting courses from David Dickey, who later joined my doctoral committee. In 2010, I completed the dissertation “Short Term Electric Load Forecasting” and received my PhD in operations research and electrical engineering. That’s when I first considered myself a forecaster.

What did you do after getting your PhD?

I continued working in that consulting firm for another few months. In 2011, I got an offer from SAS to work on some forecasting projects for large retailers. The problem was very challenging and interesting to me – how to forecast millions of products on weekly basis? At that time, smart meters were just being deployed in the US. The data would not be ready for analysis for a year or two. I thought it would be nice to take some time off from the utility industry and learn from other industries that had been dealing with hierarchical time series data for decades. I took the offer and became an analytical consultant at SAS for their retail business unit. In January 2012, the General Manager of SAS’ newly formed utilities business unit recruited me to build the energy forecasting vertical. Then I lead a team to commercialize my doctoral research into the SAS Energy Forecasting solution. After the solution was successfully launched, I headed to the next challenge – the workforce crisis in the energy industry. In August 2013, I came back to academia to become a professor, with the mission of educating the next generation of analysts.

What areas of forecasting interest you?

I’m most interested in energy forecasting, more specifically electricity demand forecasting, an area I’ve been working on since the beginning of my forecasting career. Electricity demand typically comes in with high resolution, long history, strong correlation with weather, and sometimes a hierarchy. We can use the load forecasting problem to demonstrate many forecasting techniques and methodologies. Moreover, the problem is so important because it’s tied to the life quality of billions of people on this planet. In addition to energy forecasting, I also have experience and strong interest in retail forecasting and sports forecasting. Recently, I started working on forecasting problems in the healthcare industry, another fascinating field.

Are you working with companies to improve their forecasting practices?

Yes. I maintain active consulting practices through Hong Analytics. Every year I teach 5 to 10 training courses internationally, and work on a few consulting projects to tackle some problems that are challenging in nature. These consulting projects and interactions with clients have inspired many novel research ideas. We turn these ideas into scholarly papers and teaching materials. Many other companies use our papers to improve their forecasts and forecasting practices.

What’s your proudest accomplishment in forecasting?

I have several accomplishments to be proud of, such as commercializing both my master thesis and doctoral dissertation research into software solutions, founding the IEEE Working Group on Energy Forecasting, and authoring a blog on energy forecasting, Nevertheless, my favorite one is the Global Energy Forecasting Competition. It was a team effort. Thanks to a group of enthusiastic scholars and the sponsorships from IEEE Power and Energy Society and the IIF, we have organized two competitions so far: GEFCom2012 and GEFCom2014. Both competitions attracted hundreds of participants worldwide. In addition to highlighting the winning methodologies, these competitions have made data publicly available, to encourage and enable reproducible research in the energy forecasting community. We are currently planning for the next competition. Stay tuned :)

What do you do in your free time?

Other than the family time and work time, I love blogging the most. I started my blog Energy Forecasting in 2013 after seeing Rob Hyndman’s blog Hyndsight. In 2015, the blog attracted 12,119 users from 2,146 cities across 134 countries. In my normal life as a professor living in the peer review system, I had to constantly fight with anonymous reviewers. Blogging is also an escape for me – nobody can reject my post other than myself!

Sunday, May 1, 2016

Hong Analytics One Year Anniversary: A 60-hour Energy Analytics Curriculum

One year ago, I incorporated Hong Analytics LLC to house my consulting practices. At this anniversary, I would love to review a major milestone that was recently accomplished:
A 60-hour energy analytics curriculum. 
One of the frequently asked questions I have been getting from my clients is
Tao, can you recommend some training courses I should take?
If a SAS user asked me this question, my answer would be easy:
Check out the list of my recommended SAS courses.
While the list was put together two years ago, it can no longer address all the needs from my clients. For instance, some clients want to know more about the applications of analytics in the utility industry; some do not have access to advanced analytics software; some need to develop wind and solar forecasts rather than load forecasts; some are interested in the state-of-the-art load forecasting methodologies.

To bridge the gap, I have developed a 60-hour (or 7.5 days) energy analytics curriculum. The curriculum is made of 5 courses as illustrated below:

A 60-hour Energy Analytics Curriculum
  1. T101/ Fundamentals of Utility Analytics: Techniques, Applications and Case Studies
  2. T201/ Introduction to Energy Forecasting
  3. T301/ Electric Load Forecasting I: Fundamentals and Best Practices
  4. T302/ Long Term Load Forecasting
  5. T401/ Electric Load Forecasting II: Advanced Topics and Case Studies
If you are new to the industry, analytics, or both, you can start with T101. If you are new to energy forecasting, T201 would be a good start. T301 is the flagship course that has accommodated a wide range of audience. If you are a long term load forecaster using MS Excel, you may take T302. If you are looking for the secret sauce, T401 is the level you should reach.

Did I forget to develop a master level course? No. Nobody can become a master in 60 hours. One may be able to talk like an expert after completing this 60-hour curriculum. To reach the master level, one has to spend 10,000 hours on the subject. Of course, the BigDEAL would be the #1 choice for energy forecasters!

The next offering of Fundamentals of Utility Analytics has been scheduled in Chicago, IL, August 10-11, 2016. Look forward to seeing some of you over there!

Friday, April 22, 2016

BigDEAL Students Receiving Promotions

As a professor, I find nothing better than hearing the success stories of my students. Currently I have two PhD students, Jingrui (Rain) Xie and Jon Black. Both of them are also working full time in the industry. This is the season of promotion announcements in many companies. Rain was promoted from Sr. Associate Research Statistician Developer to Research Statistician Developer, while Jon was promoted from Lead Engineer to Manager. Here I'm very pleased to feature their short biographies with the new business titles. For more details about their profiles, please check out the BigDEAL current students page.

Congratulations, Rain and Jon, for the well-deserved promotions!


Jingrui Xie
Jingrui (Rain) Xie, Research Statistician Developer, Forecasting R&D, SAS Institute Inc.
Jingrui (Rain) is pursuing her Ph.D. degree at UNC Charlotte where her research focuses on probabilistic load forecasting. Meanwhile, she also works full-time as a Research Statistician Developer at SAS Forecasting R&D. At SAS, she works on the development of SAS forecasting components and solutions, and leads the energy forecasting research. Prior to joining SAS Forecasting R&D, Rain was an analytical consultant at SAS with expertise in statistical analysis and forecasting especially on energy forecasting. She was the lead statistician developer for SAS Energy Forecasting solution and delivered consulting services to several utilities on load forecasting for their system operations, planning and energy trading.
Rain has extensive experience in energy forecasting including exploratory data analysis, selection of weather stations, outlier detection and data cleansing, hierarchical load forecasting, model evaluation and selection, forecast combination, weather normalization and probabilistic load forecasting. She also has extensive knowledge and working experience with a broad set of SAS products.

Jonathan D. Black
Jonathan D. Black, Manager of Load Forecasting, System Planning, ISO New England Inc.
Jon is currently Manager of Load Forecasting at ISO New England, where he provides technical direction for energy analytics and both short-term and long-term forecasting of load, distributed photovoltaic (PV) resources, and energy efficiency. For the past three years he has led ISO-NE’s long-term PV forecasting for the six New England states based on a variety of state policy support mechanisms, and provided technical guidance for the modeling of PV in system planning studies. Jon is directing ISO-NE’s efforts to develop enhanced short-term load forecast tools that incorporate the effects of behind-the-meter distributed PV, and has developed methods of estimating distributed PV fleet production profiles using limited historical data, as well as simulating high penetration PV scenarios to identify future net load characteristics. Jon participates in industry-leading research on forecasting and integrating large-scale renewable energy resources, and has served as a Technical Review Committee member on several multi-year Department of Energy studies. Upon joining ISO-NE in 2010, Jon assisted with the New England Wind Integration Study and the design of wind plant data requirements for centralized wind power forecasting.
Mr. Black is currently a PhD student researching advanced forecasting techniques within the Infrastructure and Environmental Systems program at the University of North Carolina at Charlotte. He received his MS degree in Mechanical Engineering from the University of Massachusetts at Amherst, where his research at the UMass Wind Energy Center explored the effects of varying weather on regional electricity demand and renewable resource availability. He is an active member of both the Institute of Electrical and Electronics Engineers (IEEE) and the Utility Variable Generation Integration Group (UVIG).

Tuesday, April 19, 2016

Improving Gas Load Forecasts with Big Data

This is my first gas load forecasting paper. We introduce the methodology, models and lessons learned from the 2015 RWE npower gas load forecasting competition, where the BigDEAL team ranked Top 3. The core idea is to leverage comprehensive weather information to improve gas load forecasting accuracy.

Citation
Jingrui Xie and Tao Hong, "Improving gas load forecasts with big data". Natural Gas & Electricity, vol. 32, no. 10, pp 25–30, 2016. doi:10.1002/gas.21905 (working paper available HERE)

Improving Gas Load Forecasts with Big Data

Jingrui Xie and Tao Hong

Abstract

The recent advancement in computing, networking, and sensor technologies has brought a massive amount of data to the business world. Many industries are taking advantage of the big data along with the modern information technologies to make informed decisions, such as managing smart cities, predicting crime activities, optimizing medicine based on genetic defects, detecting financial frauds, and personalizing marketing campaigns. According to Google Trends, the public interest in big data now is 10 times higher than it was five years ago (Exhibit 1). In this article, we will discuss gas load forecasting in the big data world. The 2015 RWE npower gas load forecasting challenge will be used as the case study to introduce how to leverage comprehensive weather information for daily gas load forecasting. We will also extend the discussion by articulating several other big data approaches to forecast accuracy improvement. Finally, we will discuss a crowdsourcing, competition-based approach to generating new ideas and methodologies for gas load forecasting.

Thursday, April 14, 2016

IJF Special Section on Probabilistic Energy Forecasting: GEFCom2014 Papers and More

As of this week, 21 of the 22 papers for the IJF Special Section on Probabilistic Energy Forecasting are on ScienceDirect (link to the CFP). Many thanks to the GEFCom2014 organizers, participants, and the expert reviewers, whose time and effort warranted an exceptionally high quality collection of energy forecasting papers. Although these papers are not yet pagerized, I can't wait to compile and post this list.

Editorial and GEFCom2014 Introduction Article

Review Article

Research Articles (Non-GEFCom2014)

Research Articles (GEFCom2014)
Enjoy reading and stay tuned for the next GEFCom!

Wednesday, April 13, 2016

Announcing BFCom2016s Winners

The Spring 2016 BigDEAL Forecasting Competition (BFCom2016s) just ended last week. I received 49 registrations from 15 countries, of which 18 teams from 6 countries completed all four rounds of the competition. I want to give my special appreciation to Prof. Chongqing Kang and his teaching assistant Mr. Yi Wang. They  organized 8 teams formulated by students from Tsinghua University, an institute prize winner of GEFCom2014. Two of the Tsinghua Teams were finally ranked among the Top 6.

The topic of BFCom2016s is ex ante short term load forecasting. I provided 4 years of historical load and temperature data, asking the contestants to forecast the next three months given historical day-ahead temperature forecasts. Three months of incremental data was released in each round.

The benchmark is made by the Vanilla model, the same as the one used in GEFCom2012. This time among the top 6 teams, five were able to beat the benchmark on average ranking, while four beat the benchmark on average MAPE. The detailed rankings and MAPEs of all teams are listed HERE.

I invited each of the top 6 teams to send me a piece of guest blog to describe their methodology. Their contributions (with my minor editorial changes) are listed below, together with the Vanilla Benchmark, which ranked No. 7.

No.1: Jingrui Xie (avg. ranking: 1.25; avg. MAPE: 5.38%)
Team member: Jingrui Xie
Affiliation: University of North Carolina at Charlotte, USA
The same model selection process was used in all four rounds. The implementation was in SAS. The model selection process follows the point forecasting model selection process implemented in Xie and Hong, IJF-2016. In this competition, the forecasting problem was dissected into three sub-problems with each of them having slightly different candidate models being evaluated.
The first sub-problem was a very-short term load forecasting problem, which considered forecasting the first day of the forecast period. The model selection process started with the "Vanilla model plus the lagged load of the previous 24th hour". It then considered the recency effect, the weekend effect, the holiday effect, the two-stage model, and the combination of forecasts as introduced in Hong, 2010 and Xie and Hong, IJF-2016.
The second sub-problem was a short term load forecasting problem, which considered forecasting the second to the seventh day of the month. The model selection process was the same to that for the very-short term load forecasting problem except that the starting benchmark model is the Vanilla model.
The third sub-problem can be categorized as a middle term load forecasting problem in which the rest of the forecast period were forecasted. The model selection process also started with the Vanilla model, but it only considered the recency effect, the weekend effect, and the holiday effect.

No.2: SMHC (avg. ranking: 3.75; avg. MAPE: 5.90%)
Team members: Zejing Wang; Qi Zeng; Weiqian Cai
Affiliation: Tsinghua University, China
We tried the support vector machine (SVM) and artificial neural networks (ANN) models in the model selection stage. We found that the ANN model had a better performance than SVM. When considering the cumulative effect, we introduced the aggregated temperatures of several hours as augmented variables, while and the number of hours was also determined in the model selection process.
In the first round, we used all the provided data for training but didn't consider the influence of holidays. Then in the next three rounds, we divided the provided data into two seasons, “summer” and “winter”. We separately forecasted the load of normal days and special holidays. These so-called seasons are not the traditional ones but were roughly defined by the plot of the average load of the given four years. Then we used the data from each seasons for training to forecast the corresponding season in 2014. This ultimately achieved a higher accuracy. All the aforementioned results and algorithms were implemented by using the MATLAB and C language.

No. 3: eps (avg. ranking: 5.25; avg. MAPE: 6.08%)
Team member: Ilias Dimoulkas
Affiliation: KTH Royal Institute of Technology, Sweden
I used the Matlab’s Neural Network toolbox for the modeling. The evolution of my model during the four rounds was as follows.
1st round: I used the “Fiiting app” which is suitable for function approximation. The training vector was IN =  [Hour Temperature] and the target vector OUT = [Load]
2nd round: I used the “Time series app” which is suitable for time series and dynamical systems. I used the Nonlinear Input-Output model instead of the Nonlinear Autoregressive with External Input model because it performs better for long term forecasting. The training vector was still IN =  [Hour Temperature] and the target vector OUT = [Load]. The number of the delays I found it works better is 5 (= 5 hourly lags).
3rd round. I used the same model but I changed the training vector to IN = [Month Weekday Hour Temperature AverageDailyTemperature MaxDailyTemperature] where AverageDailyTemperature is the average temperature and MaxDailyTemperature is the maximum temperature of the day that the specific hour belongs to.
4th round: I used two similar models with different training vectors. The final output was the average of the two models. The training vectors where IN1 = [Month Weekday Hour Temperature MovingAverageTemperature24 MovingMaxTemperature24] and IN2 = [Month Weekday Hour Temperature AverageTemperaturePreAfter4Hours MovingAverageTemperature24 MovingAverageTemperature5 MovingMaxTemperature24] where MovingAverageTemperature24 is the average temperature of the last 24 hours, MovingAverageTemperature5 is the average temperature of the last 5 hours, MovingMaxTemperature24 is the maximum temperature of the last 24 hours and AverageTemperaturePreAfter4Hours is the average temperature of the hours ranging from 4 hours before till 4 hours after the specific hour.

No. 4: Fortune Teller (avg. ranking: 6.25; avg. MAPE: 6.45%)
Member: Guangzheng Xing; Zetian Zheng; Liangzhou Wang
Affiliation: Tsinghua University, China
Round 1. Variables:Hour, Weekday, T_act, TH(the highest temperature in a day), TM(the mean temperature), TL(the lowest temperature). First of all, we used the MLR, fitting the mean load by TM, TM^2, TM^3. This method didn’t work well, the MAPE could reach about 14%. Then we used neural network, the data set contains the six variables above, and the target value is the Load_MW. The result is better, but because of improper parameters, the model was kind of overfitted, and we didn’t do the cross-validation. The result was not so good.
Round 2. We changed the parameter, and used the max value/min value/ mean value of the previous 24 hours rather than those of the day. The result was much better.
Round 3. We tried to use SVM to classify the two kinds of day curve, and then used the nnet separately. But this method did not seem to be effective. Then we used the SVM to do regression, the data set is same in nnet. Using the test set, the results of SVM and nnet were similar, so we submitted the mean value of both methods’ result.
Round 4: The MAPE of both methods reach over 7% during model selection, the result of SVM was worse, so we only submitted the result of nnet.

No. 5: Keith Bishop (avg. ranking: 6.50; avg. MAPE: 6.47%)
Team member: Keith Bishop
Affiliation: University of North Carolina-Charlotte, USA; Hepta Control Systems, USA
For my forecast, I utilized SkyFoundry’s SkySpark analytics software.  SkySpark is designed for modelling complex building systems and working with the time-series data on a wide range of levels. To support my model, I extended the inherent functionality of this software to support polynomial regression.  My model itself went through several iterations.  The first of these was fairly similar to Dr. Hong’s Vanilla Model with the exception that instead of clustering by month, I clustered based on whether the date was a heating or cooling date.  The heating or cooling determination was made by fitting a third-degree polynomial curve to each, hourly clustered, load-temperature scatter plot, solving for the minimums and then calculating the change-over point by averaging these hourly values.  If the average temperature for a day was above this point, it was a cooling day and vice-versa.  As my model progressed, I incorporated monthly clustering and the recency effect discussed in Electric load forecasting with recency effect: A big data approach.  With the recency effect, I optimized the number of lag hours for each monthly cluster by creating models for each of the past 24-hours and selecting the one with the lowest error.  In the end, I was able to reduce the MAPE of the forecast against the known data from 8.51% down to 5.01%.

No. 6: DUFEGO (avg. ranking: 7.25; avg. MAPE: 6.39%)
Team members: Lei Yang; Lanjiao Gong; Yating Su
Affiliation: Dongbei University of Finance and Economics, China
During the 4-round competition,we selected MATLAB as our tool. We use multiple linear regression models (MLR), each of which has 291 variables including trend, polynominal terms,interaction terms and recency effect. We just used all past historical data without cleansing the data. Considering the forecasting task is to improve predicting accuracy rather than the goodness of fit, we seperated the data into training set and validation set. We used cross validation and out of sample test method to select variables to give our model more generalizaton ability.
In Round 1, we trained one MLR model using the entire historical data. In Round 2, we roughly grouped the historical data by season (such as January - March and April - June,) and trained four MLR models, which improved the results significantly. We also found the distinct relationship between temperature and load in different temporal dimensions.We did some work about selecting the best MLR model in different temporal dimensions and found seasonal separate better. We made a mistake in Round 3 that resulted in a very high MAPE.

No. 7: Vanilla Benchmark (avg. ranking: 7.25; avg. MAPE: 6.42%)
The model is the same as the one used in GEFCom2012. See Hong, Pinson and Fan, IJF2014 for more details. All available historical data in each round was used to estimate the model.

Finally, congratulations to these top 6 teams of BFCom2016s, and many thanks to all of you who participated and are interested in BFCom2016s!