Showing posts with label big data. Show all posts

Thursday, June 20, 2019

Energy Forecasting in the Big Data World

All papers for the International Journal of Forecasting special section on energy forecasting in the big data world have been published online. Out of 14 papers collected for this special section, eight are from GEFCom2017 documenting winning methods, while the other six non-GEFCom2017 papers cover diverse topics in the areas of energy supply, demand and price forecasting.

The guest editorial is HERE. Below is the list of special section papers:
  1. Tao Hong, Jingrui Xie, and Jonathan Black. Global Energy Forecasting Competition 2017: Hierarchical probabilistic load forecasting
  2. Florian Ziel. Quantile regression for the qualifying match of GEFCom2017 probabilistic load forecasting.
  3. I. Dimoulkas, P. Mazidi, and L. Herre. Neural networks for GEFCom2017 probabilistic load forecasting.
  4. Slawek Smyl and N. Grace Hua. Machine learning methods for GEFCom2017 probabilistic load forecasting.
  5. Andrew J. Landgraf. An ensemble approach to GEFCom2017 probabilistic load forecasting.
  6. Cameron Roach. Reconciled boosted models for GEFCom2017 hierarchical probabilistic load forecasting.
  7. Julian de Hoog and Khalid Abdulla. Data visualization and forecast combination for probabilistic load forecasting in GEFCom2017 final match.
  8. Isao Kanda and J.M. Quintana Veguillas. Data preprocessing and quantile regression for probabilistic load forecasting in the GEFCom2017 final match.
  9. Stephen Haben, Georgios Giasemidis, Florian Ziel, and Siddharth Arora. Short term load forecasting and the effect of temperature at the low voltage level.
  10. Jakob W. Messner and Pierre Pinson. Online adaptive lasso estimation in vector autoregressive models for high dimensional wind power forecasting
  11. Dazhi Yang, Elynn Wu, Jan Kleissl. Operational solar forecasting for the real-time market.
  12. Grzegorz Marcjasz, Bartosz Uniejewski, and Rafał Weron. On the importance of the long-term seasonal component in day-ahead electricity price forecasting with NARX neural networks.
  13. Bartosz Uniejewski, Grzegorz Marcjasz, and Rafał Weron. Understanding intraday electricity markets: Variable selection and very short-term price forecasting using LASSO.
  14. Xuerong Li, Wei Shang, and Shouyang Wang. Text-based crude oil price forecasting: A deep learning approach.

Citation 

Tao Hong and Pierre Pinson, "Energy forecasting in the big data world," International Journal of Forecasting, vol. 35, no. 4, pp. 1387-1388, 2019. 

Energy Forecasting in the Big Data World

Tao Hong and Pierre Pinson

Modern information and communication technologies have brought big data to virtually every segment of the energy and utility industries. While forecasting is an important and necessary step in the data-driven decision-making process, the problem of generating better forecasts in the world of big data is an emerging issue and a challenge to both industry and academia. This special section aims to collect top-quality forecasting articles that document cutting-edge research findings and best practices on a wide range of important business problems in the energy industry. Our emphasis is on big data, such as forecasting with high resolution data, the use of high-dimensional processes, forecasting in real-time, and the use of non-traditional data and variables. 

Monday, July 9, 2018

From Club Convergence of Per Capita Industrial Pollutant Emissions to Industrial Transfer Effects: An Empirical Study Across 285 Cities in China

China has grown to the world's second largest economy by nominal GDP. Many factors attribute to such rapid growth, such as globalization and hard-working Chinese people. Nevertheless, we can't ignore the pollution resulted from the industrialization. Dr. Chang Liu brought the research problem to me when she visited BigDEAL last year. We spent a year investigating the relationship between industrial transfer effects and per capita industrial pollutant emissions across 285 cities in China. We identified four convergence clubs for SO2 emissions, and three convergence clubs for soot emissions. We also concluded that industrial transfer effects can lead to multiple steady-state equilibria. This presents some evidence to support region-specific environmental policies and execution strategies. 

This is the first time I sent a paper to Energy Policy. The original version was submitted on Feb 5, 2018. Within five months, the paper was published after three revisions. The entire publication process was quite pleasant.

Citation
Chang Liu, Tao Hong, Huaifeng Liu, and Lili Wang, "From club convergence of per capita industrial pollutant emissions to industrial transfer effects: an empirical study across 285 cities in China," Energy Policy, vol.121, pp 300-313, October 2018. (ScienceDirect)

From Club Convergence of Per Capita Industrial Pollutant Emissions to Industrial Transfer Effects: An Empirical Study Across 285 Cities in China

Chang Liu, Tao Hong, Huaifeng Liu, and Lili Wang

Abstract

The process of industrialization has led to an increase in air pollutant emissions in China. At the regional level, industrial restructuring and industrial transfer from eastern China to western China have caused a significant difference in pollutant emissions among various cities. This paper analyzes per capita industrial pollutant emissions across 285 prefecture-level cities from 2003 to 2015, aiming to reveal how industrial transfer affects the formation of convergence clubs. Whether industrial pollutant emissions across heterogeneous cities converge to a unique steady-state equilibrium is first identified based on the concept of club convergence. Logit regression analysis is then applied to assess the effects of industrial transfer on the observed clubs. The log t-test highlights four convergence clubs for industrial SO2 emissions and three clubs for industrial soot emissions. The regression analysis results reveal that the effects of industrial transfer can lead to multiple steady-state equilibria, suggesting region-specific environmental policies and execution strategies. In addition, accelerating the development of clean energy technologies in emission-intense regions should be further emphasized. 

Friday, April 27, 2018

Weather Data for Energy Analytics

Being an energy forecaster, I am genuinely interested in meteorology. I even recruited a master student who was a practicing meteorologist in Hawaii (see the blog post about Ying Chen). The more energy forecasting projects I conduct, the more I appreciate the value of weather data. In GEFCom2014, the top 1 place of the solar track was a team of meteorologists from Australia, who completely dominated the track. In GEFCom2017, the top 1 place of the final match was a team of meteorologists from Japan. I truly believe that the energy forecasting community can better leverage meteorology than what we do today. Here is an article about two use cases of weather data for energy analytics. In fact we merged two papers into one by removing the sophisticated mathematics and statistics to keep the story readable to a broad audience. The IEEE Power and Energy Society is so kind to offer the open access to this paper, so that people can read it for free.

Citation

Jonathan Black, Alex Hofmann, Tao Hong, Joseph Roberts, and Pu Wang, "Weather data for energy analytics: from modeling outages and reliability indices to simulating distributed photovoltaic fleets," IEEE Power and Energy Magazine, vol.16, no.3, pp 43-53, May-June 2018. (Open AccessIEEE Xplore)


Weather Data for Energy Analytics

From Modeling Outages and Reliability Indices to Simulating Distributed Photovoltaic Fleets

Jonathan Black, Alex Hofmann, Tao Hong, Joseph Roberts, and Pu Wang

Abstract

Weather impacts virtually all facets of our daily life. As a result, many business sectors are affected by weather conditions, and the power industry is no exception. Weather is a major influencer on system reliability and a key driver of both power supply and demand. In this article, we will demonstrate novel uses of weather data for energy analytics via two utility applications. We first use easily accessible weather data together with regression analysis to model distribution outages and construct a probabilistic view of reliability indices that helps reveal a utility’s reliability trend. We then use high-resolution, commercial-grade weather data to develop realistic simulations of anticipated behind-the-meter photovoltaic (PV) fleets

Friday, March 23, 2018

Review of Smart Meter Data Analytics: Applications, Methodologies, and Challenges

About 10 years ago, the term "smart grid" was officially defined in the Energy Independence and Security Act of 2007 (EISA-2007). Soon after that, many power companies started their smart meter deployments. As of 2016, more than 70 million smart meters were installed in the united states. The world installed base was projected to reach 780 million by 2020, pushed by the mass roll-outs in China. We are now sitting on a gold mine of data collected by these smart meters. Last year I gave a forecast:
The energy companies will be moving more Gigabytes of data than GWh of electricity.
The scientific community has been trying to understand the smart meter data and get some actionable insights out of it. Thousands of papers have been published in the recent decade on the various aspects of smart meter data analytics. Last year, I worked with my collaborators in Tsinghua University to complete a review of smart meter data analytics. The paper was just put on the IEEE Xplore yesterday.

This is the longest paper ever published by the IEEE Transactions on Smart Grid. I'm sure reading this 24-page review article can save the readers significant amount of time from digging thousands of papers in the literature. Load forecasters may find some interesting stuff in Section III, which is dedicated to load forecasting in the smart grid era.

Citation

Yi Wang, Qixin Chen, Tao Hong, and Chongqing Kang, "Review of smart meter data analytics: applications, methodologies, and challenges," IEEE Transactions on Smart Grid, in press. (working paper; IEEE Xplore)

Review of Smart Meter Data Analytics: Applications, Methodologies, and Challenges

Yi Wang, Qixin Chen, Tao Hong, and Chongqing Kang

Abstract

The widespread popularity of smart meters enables an immense amount of fine-grained electricity consumption data to be collected. Meanwhile, the deregulation of the power industry, particularly on the delivery side, has continuously been moving forward worldwide. How to employ massive smart meter data to promote and enhance the efficiency and sustainability of the power grid is a pressing issue. To date, substantial works have been conducted on smart meter data analytics. To provide a comprehensive overview of the current research and to identify challenges for future research, this paper conducts an application-oriented review of smart meter data analytics. Following the three stages of analytics, namely, descriptive, predictive and prescriptive analytics, we identify the key application areas as load analysis, load forecasting, and load management. We also review the techniques and methodologies adopted or developed to address each application. In addition, we also discuss some research trends, such as big data issues, novel machine learning technologies, new business models, the transition of energy systems, and data privacy and security.

Friday, February 2, 2018

Load Forecasting Using 24 Solar Terms

Can we use Chinese calendar to forecast the load in the U.S.? Since I started my load forecasting practice 10 years ago, this has been a question sitting in my mind. One year ago, we decided to the test this idea. In short, the answer is YES. In the big data era, this approach would fall in the category of leveraging a variety of data sources.

This paper will be collected in the MPCE special section "Forecasting in Modern Power Systems" (Call For Papers). The paper is open access, so you can read the full content and download the PDF file for free. Special thanks to the journal editorial office for the neat copy-editing work. I truly enjoyed the publication process. Unlike most other open access journals that charge the authors a big fee for publishing the papers, this one does not charge a dime. I would highly recommend this journal to those who are interested in publishing open access papers in energy forecasting but do not want to pay for the publication fees. 

Citation
Jingrui Xie and Tao Hong, "Load forecasting using 24 solar terms," Journal of Modern Power Systems and Clean Energy, in press, available online. (open access

Load Forecasting Using 24 Solar Terms

Jingrui Xie and Tao Hong

Abstract

Calendar is an important driving factor of electricity demand. Therefore, many load forecasting models would incorporate calendar information. Frequently used calendar variables include hours of a day, days of a week, months of a year, and so forth. During the past several decades, a widely-used calendar in load forecasting is the Gregorian calendar from the ancient Rome, which dissects a year into 12 months based on the Moon’s orbit around the Earth. The applications of alternative calendars have rarely been reported in the load forecasting literature. This paper aims at discovering better means than Gregorian calendar to categorize days of a year for load forecasting. One alternative is the solar-term calendar, which divides the days of a year into 24 terms based on the Sun’s position in the zodiac. It was originally from the ancient China to guide people for their agriculture activities. This paper proposes a novel method to model the seasonal change for load forecasting by incorporating the 24 solar terms in regression analysis. The case study is conducted for the eight load zones and the system total of ISO New England. Results from both cross-validation and sliding simulation show that the forecast based on the 24 solar terms is more accurate than its counterpart based on the Gregorian calendar.

Friday, August 18, 2017

IEEE PES Announces Winning Teams for Global Energy Forecasting Competition 2017


More than 300 students and professionals from more than 30 countries formed 177 teams to compete on hierarchical probabilistic load forecasting, exploring opportunities from the big data world and tackling the analytical challenges.

PISCATAWAY, N.J., USA, August 18, 2017 – IEEE, the world's largest professional organization advancing technology for humanity, today announced the results of the Global Energy Forecasting Competition 2017 (GEFCom2017), which was organized and supported by the IEEE Power & Energy Society (IEEE PES) and the IEEE Working Group on Energy Forecasting (WGEF).

Wednesday, August 9, 2017

Benchmarking Robustness of Load Forecasting Models under Data Integrity Attacks

GIGO - garbage in, garbage out. In forecasting, GIGO means that if the model is fed with garbage (bad) data, the forecast would be bad too. In the power industry, bad load forecasts often result in waste of energy resources, financial losses, brownouts or even blackouts.

Anomaly detection and data cleansing procedures may help alleviate some of the bad data from the input side. However, what if the bad data was created by hackers? Can the existing models "survive" or stay accurate under data attacks? This paper offers some benchmark results.

This paper sets a few "first":
  1. This is the first paper formally addressing the cybersecurity issues in the load forecasting literature. I believe that the data attacks should be of a great concern to the forecasting community. This paper sets a solid ground for future research. 
  2. This is my first journal paper co-authored with a professor in my doctoral committee, Dr. Shu-Cherng Fang. Many years ago, I picked up the topic of my dissertation from one of my consulting projects. I then invited a team of world class professors from different areas to form the committee. None of them were really into load forecasting, though I had the opportunities learning from different perspectives. 
  3. This is my first journal paper that went through one year of peer review cycle, the longest peer review I've experienced. It's definitely worth the effort. The IJF editors and reviewers certainly spent a significant amount of time reading the paper and offered so many constructive comments. I wish I could know their names and identify them in the acknowledgement section.
Citation

Jian Luo, Tao Hong and Shu-Cherng Fang, "Benchmarking robustness of load forecasting models under data integrity attacks", International Journal of Forecasting, accepted. (working paper)


Benchmarking robustness of load forecasting models under data integrity attacks

Jian Luo, Tao Hong and Shu-Cherng Fang

Abstract

As the internet continues to expand its footprint, cybersecurity has become a major concern for the governments and private sectors. One of the cybersecurity issues is on data integrity attacks. In this paper, we focus on the power industry, where the forecasting processes heavily rely on the quality of data. The data integrity attacks are expected to harm the performance of forecasting systems, which greatly impact the financial bottom line of power companies and the resilience of power grids. Here we reveal how data integrity attacks can affect the accuracy of four representative load forecasting models (i.e., multiple linear regression, support vector regression, artificial neural networks, and fuzzy interaction regression). We first simulate some data integrity attacks by randomly injecting some multipliers that follow a normal or uniform distribution to the load series. Then the aforementioned four load forecasting models are applied to generate one-year ahead ex post point forecasts for comparisons of their forecast errors. The results show that the support vector regression model, trailed closely by the multiple linear regression model, is most robust, while the fuzzy interaction regression model is least robust among the four. Nevertheless, all of the four models fail to provide satisfying forecasts when the scale of data integrity attacks becomes large. This presents a serious challenge to the load forecasters and the broader forecasting community: How to generate accurate forecasts under data integrity attacks? We use the publicly-available data from Global Energy Forecasting Competition 2012 to construct the case study. At the end, we also offer an outlook of potential research topics for future studies.

Wednesday, May 17, 2017

Wind Speed for Load Forecasting Models

One way to categorize the load forecasting papers is based on the variables used in those forecasting models. Because many people who wrote load forecasting papers only had access to the load data with time stamps, they had to propose the models based on the load series only. The representative techniques include exponential smoothing and the ARIMA family. Sometimes people also include the calendar information to come up with some regression models with classification variables. Although these are good and powerful techniques, their real-world applications in load forecasting are very limited. I have criticized those "load-only" models in some of my papers, such as the IJF2016 paper on recency effect:
Both seasonal naïve models perform very poorly compared with the other four models. Seasonal naïve models are used commonly for benchmarking purposes in other industries, such as the retail and manufacturing industries. In load forecasting, the two applications in which seasonal naïve models are most useful are: (1) benchmarking the forecast accuracy for very unpredictable loads, such as household level loads; and (2) comparisons with univariate models. In most other applications, however, the seasonal naïve models and other similar naïve models are not very meaningful, due to the lack of accuracy. 

Thursday, May 4, 2017

7 Reasons to Attend ISEA2017

The International Symposium on Energy Analytics (ISEA2017) is coming in 7 weeks. If you are still wondering whether you should join the event or not, here are 7 reasons for you to attend ISEA2017:

1. Grow your international network

ISEA2017 is truly international. The early registrations came from 16 countries. As a conference attendee, you will hear 20+ presentations describing methodologies and insights gained from various places in the world. You will also share your experience and expertise with this diverse audience and get their critique and compliment.

2. Check out the winning methods of GEFCom2017

Selected GEFCom2017 teams will be presenting their methodologies at ISEA2017. You will witness the recognition of GEFCom2017 winners and have the face-to-face discussion with them. Rather than reading thousands of energy forecasting papers published every year and wondering which ones work well, you can grasp the secret sauce of the most effective methods during ISEA2017.

3. Experience a novel peer review process 

Whether we like today's peer review system or not, we have to live with it, at least for the next few years before a better one is in place. We have tied ISEA2017 to an IJF special section on energy forecasting, where we try to implement a new peer review process. The ISEA2017 attendees will have the opportunity to experience this new process and help improve it.

4. Peek and shape the future of energy analytics 

If you are struggling with the topic for your next paper, ISEA2017 is a must-attend conference for you. We will discuss the emerging topics as well as the research agenda for the future. Rather than guessing where the future goes, you can contribute to the plan!

5. Attend International Symposium on Forecasting

The 37th International Symposium on Forecasting (ISF) will be held two days after ISEA2017, right at the same location. ISF is the only major scientific forecasting conference I know of. I find it very rewarding to attend ISF, where I hear forecasting topics from various industries, as well as the methodological breakthroughs in general. Many of them could be applied to the energy forecasting problems. Extending the trip to include ISF in your travel plan would be a wise choice.

6. Two world heritage sites in one place

The World Heritage Centre has a list of about 1000 world heritage sites around the globe. Two of them (Great Barrier Reef and Daintree Rainforest) are in Cairns, Australia, making Cairns the only place in this planet with two world heritage sites side by side. ISF organizers have planned the social program including numerous social events and tour opportunities for delegates, their friends and family.

7. Low registration fees

Our sponsors, the International Institute of Forecasters, Tangent Works and Journal of Modern Power Systems and Clean Energy, have generously contributed to the organization of ISEA2017, helping significantly subsidize the registration fees. If you attend both ISEA and ISF, there is an additional discount. To register both ISEA and ISF, click HERE. To register ISEA only, click HERE.

ISEA2017 will be held in Cairns, Australia, June 22-23, 2017. Look forward to seeing you there!

Friday, October 14, 2016

GEFCom2017: Hierarchical Probabilistic Load Forecasting

IEEE Working Group on Energy Forecasting invites you to join the Global Energy Forecasting Competition 2017 (GEFCom2017): Hierarchical Probabilistic Load Forecasting.

Background

Emerging technologies, such as microgrids, electric vehicles, rooftop solar panels and intelligent batteries, are challenging the traditional operational practices of the power industry. While uncertainties on the demand side are pushing the operational excellence toward the edge of the grid, probabilistic load forecasting at various levels of the power system hierarchy is becoming increasingly important.

GEFCom2017 will bring together state-of-the-art techniques and methodologies for hierarchical probabilistic energy forecasting. The competition features a bi-level setup: a three-month qualifying match that includes two tracks, and a one-month final match on a large-scale problem.

Qualifying match

The qualifying match means to attract and educate a large number of contestants with diverse background, and to prepare them for the final match. The qualifying match includes two tracks, both on forecasting the zonal and total loads of ISO New England (the "DEMAND" column) for the next month in real-time on rolling basis.

The defined-data track (GEFCom2017-D) restricts the data used by the contestants. The data cannot go beyond the calendar data, load (the "DEMAND" column) and temperature data (the "DryBulb" and "DewPnt" columns) provided by ISO New England via the zonal information page of the energy, load and demand reports,  plus the US Federal Holidays as published via US Office of Personnel Management. The contestants may infer day of week and Federal Holidays based on the aforementioned data.

The open-data track (GEFCom2017-O)encourages the contestants to explore various public and private data sources and bring the necessary data into the load forecasting process. The data may include, but is not limited to the data published by ISO New England, the weather forecast data from any weather service providers, the local economy information, the penetration of solar PV published by US government websites.

Final match

The final match (GEFCom2017-F) will be open to the top entries from the qualifying match, tackling a more challenging, larger scale problem than the qualifying match problems. The final match includes one-track only, forecasting the load of a few hundred delivery points of a U.S. utility. The data is from the real world, so the contestants should expect many data issues, such as load transfers and anomalies. Details of the final match will be released on March 15, 2017.

Submission method

To save competition platform costs and implement more sophisticated evaluation methods, the submission will be via email. Within two weeks of the registration, the contestants will receive an email with the instructions about how to submit the forecasts.

Evaluation 

The "DEMAND" column published by ISO New England will be used to evaluate the skills of the probabilistic forecasts. Note that the "DEMAND" data may be revised during the settlement process. The version at the time of evaluation will be used to score the forecasts.

The evaluation metric is quantile score. For each forecasted period, the quantile score of a submitted forecast will be compared with the quantile score of the benchmark. The relative improvement over the benchmark will be used to rate and rank the teams.

World Energy Forecaster Rankings (WEFR)

Many contestants who joined GEFCom2012 also participated in GEFCom2014. To encourage the continuous investments in energy forecasting and recognize those who excel in these competitions, we will start building the World Energy Forecaster Rankings.

The contestants of GEFCom2017 will be eligible to participate in WEFR. We hope the rankings can help reward the participants with career opportunities and tickets to future competitions. In addition, editors of relevant journals can also leverage WEFR to enhance the peer review process.

Prize

IEEE Power and Energy Society budgeted 20,000 for this competition. The prize pool is $18,000, to be shared among the winning teams and institutions from qualifying match and final match.

Publication

Winning teams will be invited to submit papers to a special issue of the International Journal of Forecasting. 

Registration

The maximum team size is three. The team leader should register on behalf of the team. The registration period is from Oct 14, 2016 to Jan 14, 2017. Please register via THIS LINK if you want to join the competition.

Competition timeline
  • Competition Problems Release  --  Oct 14, 2016
  • Qualifying Match Starts  --  Dec 1, 2016
  • Qualifying Match Ends  --  Feb 28, 2017
  • Final Match Data Release  --  Mar 15, 2017
  • Final Match Submission Due  --  May 15, 2017

Additional rules

For any questions or comments, please put them in the comment field below. Please link your name to your LinkedIn profile. 

Sunday, September 11, 2016

Call For Sponsors: 2017 International Symposium on Energy Analytics (ISEA2017)

The first International Symposium on Energy Analytics (ISEA2017) will be held in Cairns, Australia, June 22-23, 2017. Cairns is the only place in the world where two World Heritage listed areas are side-by-side: The Great Barrier Reef and The Daintree Rainforest, For more information about Cairns, please visit the Cairns visitors information guide.

ISEA2017 features the theme "Predictive Energy Analytics in the Big Data World". The topics of interest can be found HERE. We expect about 50 attendees, 1/3 from academia and 2/3 from the industry. ISEA2017 is right before the 37th International Symposium on Forecasting (ISF2017), the flagship conference of the International Institute of Forecasters (IIF). Attendees of ISEA2017 will also get a discounted registration to ISF2017.

IIF is a major sponsor of ISEA2017. We are also looking for additional sponsors to keep the cost down for attendees. The sponsor information is highly visible at ISEA2017 and its website, as well as through the email and social media campaigns. This is a great opportunity to support the energy forecasting community, promote your organization and show off your products and services. For your energy analysts, this symposium would be a great venue to learn from and network with peers from other organizations.

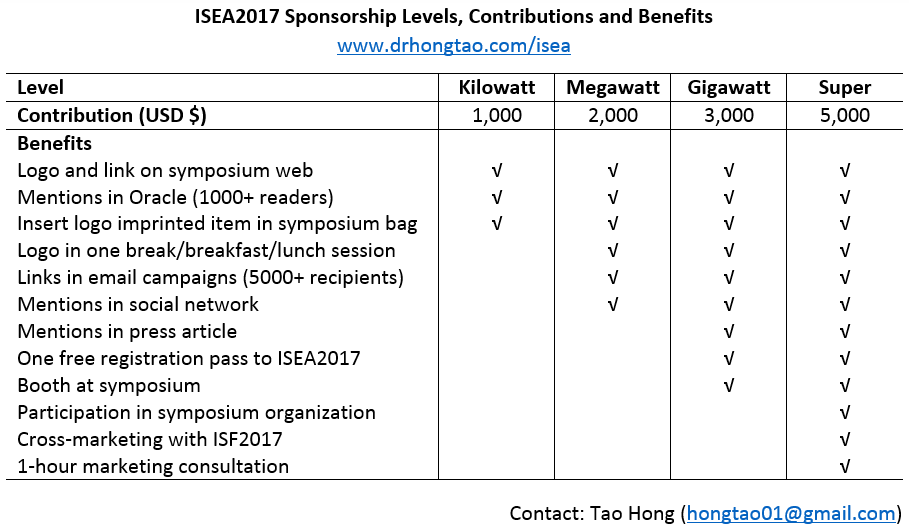
The sponsorship can be on any of the four levels as listed below. If you are interested in sponsoring the event, please contact me via email: hongtao01 AT gmail DOT com.


Wednesday, August 24, 2016

Guest Editorial: Big Data Analytics for Grid Modernization

IEEE Transactions on Smart Grid just published our special section on Big Data Analytics for Grid Modernization. The guest editorial is on IEEE Xplore with open access. The original Call for Papers is HERE.

While "big data" is quickly becoming a buzz word (see THIS POST), in this guest editorial we discussed our interpretation from four aspects:
  1. The data involved in the analysis is big in at least one of its three defining dimensions: volume, variety or velocity. The big data used in the utility industry includes but is not limited to smart meter data, phasor measurement unit data, weather data, and social media data. 
  2. The problem under investigation is to prepare for analyzing the big data, such as data compression and data security issues. 
  3. The methodology requires customized modeling of individual components of a system, or leads to in-depth understanding of the individual components. For instance, estimating the invisible solar generation belongs to this category. 
  4. The technology can be used to help reach the answer faster, or answer the questions otherwise difficult to answer. For example, a distributed platform can be used to speed up the analytic tasks.
Thanks to the diligent work from our guest editors, reviewers and the authors, we are able to present a high-quality collection of papers to the community. Below is the list of 17 special section papers:
  1. D. Zhou, J. Guo, Y. Zhang, J. Chai, H. Liu, Y. Liu, C. Huang, X. Gui and Y. Liu, "Distributed Data Analytics Platform for Wide-Area Synchrophasor Measurement Systems," IEEE Transactions on Smart Grid, vol. 7, no. 5, pp. 2397-2405, Sept. 2016
  2. P. H. Gadde, M. Biswal, S. Brahma and H. Cao, "Efficient Compression of PMU Data in WAMS," IEEE Transactions on Smart Grid, vol. 7, no. 5, pp. 2406-2413, Sept. 2016
  3. X. Tong, C. Kang and Q. Xia, "Smart Metering Load Data Compression Based on Load Feature Identification," IEEE Transactions on Smart Grid, vol. 7, no. 5, pp. 2414-2422, Sept. 2016
  4. J. Hu and A. V. Vasilakos, "Energy Big Data Analytics and Security: Challenges and Opportunities," IEEE Transactions on Smart Grid, vol. 7, no. 5, pp. 2423-2436, Sept. 2016
  5. Y. Wang, Q. Chen, C. Kang and Q. Xia, "Clustering of Electricity Consumption Behavior Dynamics Toward Big Data Applications," IEEE Transactions on Smart Grid, vol. 7, no. 5, pp. 2437-2447, Sept. 2016
  6. S. Ben Taieb, R. Huser, R. J. Hyndman and M. G. Genton, "Forecasting Uncertainty in Electricity Smart Meter Data by Boosting Additive Quantile Regression," IEEE Transactions on Smart Grid, vol. 7, no. 5, pp. 2448-2455, Sept. 2016
  7. H. Shaker, H. Zareipour and D. Wood, "Estimating Power Generation of Invisible Solar Sites Using Publicly Available Data," IEEE Transactions on Smart Grid, vol. 7, no. 5, pp. 2456-2465, Sept. 2016
  8. H. Shaker, H. Zareipour and D. Wood, "A Data-Driven Approach for Estimating the Power Generation of Invisible Solar Sites," IEEE Transactions on Smart Grid, vol. 7, no. 5, pp. 2466-2476, Sept. 2016
  9. X. Zhang and S. Grijalva, "A Data-Driven Approach for Detection and Estimation of Residential PV Installations," IEEE Transactions on Smart Grid, vol. 7, no. 5, pp. 2477-2485, Sept. 2016
  10. H. Wang and J. Huang, "Cooperative Planning of Renewable Generations for Interconnected Microgrids," IEEE Transactions on Smart Grid, vol. 7, no. 5, pp. 2486-2496, Sept. 2016
  11. J. Peppanen, M. J. Reno, R. J. Broderick and S. Grijalva, "Distribution System Model Calibration With Big Data From AMI and PV Inverters," IEEE Transactions on Smart Grid, vol. 7, no. 5, pp. 2497-2506, Sept. 2016
  12. Y. C. Chen, J. Wang, A. D. Domínguez-García and P. W. Sauer, "Measurement-Based Estimation of the Power Flow Jacobian Matrix," IEEE Transactions on Smart Grid, vol. 7, no. 5, pp. 2507-2515, Sept. 2016
  13. H. Sun, Z. Wang, J. Wang, Z. Huang, N. Carrington and J. Liao, "Data-Driven Power Outage Detection by Social Sensors," IEEE Transactions on Smart Grid, vol. 7, no. 5, pp. 2516-2524, Sept. 2016
  14. H. Jiang, X. Dai, D. W. Gao, J. J. Zhang, Y. Zhang and E. Muljadi, "Spatial-Temporal Synchrophasor Data Characterization and Analytics in Smart Grid Fault Detection, Identification, and Impact Causal Analysis," IEEE Transactions on Smart Grid, vol. 7, no. 5, pp. 2525-2536, Sept. 2016
  15. M. Rafferty, X. Liu, D. M. Laverty and S. McLoone, "Real-Time Multiple Event Detection and Classification Using Moving Window PCA," IEEE Transactions on Smart Grid, vol. 7, no. 5, pp. 2537-2548, Sept. 2016
  16. T. Jiang, Y. Mu, H. Jia, N. Lu, H. Yuan, J. Yan and W. Li, "A Novel Dominant Mode Estimation Method for Analyzing Inter-Area Oscillation in China Southern Power Grid," IEEE Transactions on Smart Grid, vol. 7, no. 5, pp. 2549-2560, Sept. 2016
  17. B. Wang, B. Fang, Y. Wang, H. Liu and Y. Liu, "Power System Transient Stability Assessment Based on Big Data and the Core Vector Machine," IEEE Transactions on Smart Grid, vol. 7, no. 5, pp. 2561-2570, Sept. 2016

Citation

Tao Hong, Chen Chen, Jianwei Huang, Ning Lu, Le Xie and Hamidreza Zareipour, "Guest Editorial: big data analytics for grid modernization", IEEE Transactions on Smart Grid, vol.7, no.5, pp 2395-2396, September, 2016

Guest Editorial: Big Data Analytics for Grid Modernization

Tao Hong, Chen Chen, Jianwei Huang, Ning Lu, Le Xie and Hamidreza Zareipour

Saturday, May 21, 2016

Call For Papers: 2017 International Symposium on Energy Analytics (ISEA2017)

2017 International Symposium on Energy Analytics
(ISEA2017)
Cairns, Australia, June 22-23, 2017
Predictive Energy Analytics in the Big Data World


Modern information and communication technologies have brought big data to virtually every segment of the energy and utility industries. While predictive analytics is an important and necessary step in the data-driven decision-making process, how to generate better forecasts in the big data world is an emerging issue and challenge to both industry and academia.

This symposium aims at bringing forecasting experts and practitioners together to share experiences and best practices on a wide range of important business problems in the energy industry. Here the energy industry broadly covers utilities, oil, gas and mining industries. The subjects to be forecasted range from supply, demand and price, to asset/system condition and customer count.

The topics of interest include but are not limited to:
  • Probabilistic energy forecasting
  • Hierarchical energy forecasting
  • High-dimensional energy forecasting
  • High-frequency and high-resolution energy forecasting
  • Equipment failure prediction
  • Power systems fault prediction
  • Automatic outlier detection
  • Load profiling
  • Customer segmentation
  • Customer churn prediction
If you are interested in contributing a presentation to this symposium, please submit a one-page extended abstract to both guest editors via email with the subject line “ISEA2017 Abstract Submission”. Authors of selected abstracts will be invited to submit full papers to the International Journal of Forecasting (IJF) or Power and Energy Magazine.

Important ISEA2017 dates
  • Abstract submission open - November 15, 2016
  • Abstract submission due - January 15, 2017
  • Abstract acceptance - February 15, 2017
  • Early registration deadline - April 14, 2017
  • ISEA2017 - June 22-23, 2017
  • ISF2017 - June 25-28, 2017
  • Paper submission for consideration of journal/magazine publication - June 30, 2017
Important publication dates
  • First round review completion - August 31, 2017
  • Final version ready for Power and Energy Magazine - October 31, 2017
  • Final version ready for IJF - December 31, 2017
  • Power and Energy Magazine special issue publication - May/June, 2018
  • IJF special section publication - 2018

Guest Editors:
Tao Hong, University of North Carolina at Charlotte, USA (hong@uncc.edu)
Pierre Pinson, Technical University of Denmark, Denmark (ppin@elektro.dtu.dk)

Editor-in-Chief
Rob J Hyndman, Monash University, Australia
International Journal of Forecasting

Tuesday, April 19, 2016

Improving Gas Load Forecasts with Big Data

This is my first gas load forecasting paper. We introduce the methodology, models and lessons learned from the 2015 RWE npower gas load forecasting competition, where the BigDEAL team ranked Top 3. The core idea is to leverage comprehensive weather information to improve gas load forecasting accuracy.

Citation
Jingrui Xie and Tao Hong, "Improving gas load forecasts with big data". Natural Gas & Electricity, vol. 32, no. 10, pp 25–30, 2016. doi:10.1002/gas.21905 (working paper available HERE)

Improving Gas Load Forecasts with Big Data

Jingrui Xie and Tao Hong

Abstract

The recent advancement in computing, networking, and sensor technologies has brought a massive amount of data to the business world. Many industries are taking advantage of the big data along with the modern information technologies to make informed decisions, such as managing smart cities, predicting crime activities, optimizing medicine based on genetic defects, detecting financial frauds, and personalizing marketing campaigns. According to Google Trends, the public interest in big data now is 10 times higher than it was five years ago (Exhibit 1). In this article, we will discuss gas load forecasting in the big data world. The 2015 RWE npower gas load forecasting challenge will be used as the case study to introduce how to leverage comprehensive weather information for daily gas load forecasting. We will also extend the discussion by articulating several other big data approaches to forecast accuracy improvement. Finally, we will discuss a crowdsourcing, competition-based approach to generating new ideas and methodologies for gas load forecasting.

Monday, March 28, 2016

Relative Humidity for Load Forecasting Models

The ultimate driver of using big data for predictive modeling and forecasting, in my opinion, is customization. Obviously, such customization can be reflected by providing special treatments to individual regions in a territory and individual hours of a day, as discussed in my recent IJF paper Electric Load Forecasting with Recency Effect: A Big Data Approach. In this paper, we are taking another big data approach to load forecasting by breaking a composite variable Heat Index. We show that the NWS' formula for Heat Index is not really designed for load forecasting.

The paper went through three rounds of reviews with 5 reviewers. Most reviewers were very good at providing helpful comments. Only one reviewer raised a few interesting but naive comments. I didn't bother to please him/her by revising my paper. Nevertheless, I would love to list them here so that other authors can use my argument to respond to similar comments.

1. "Twenty-five papers and previous works are cited in this paper, with exactly 54 references along the paper. On these 54 times, the authors are citing themselves at least 31 times" [...]"This behavior tends to give the reader a strange feeling and do not give a lot of credit to your work: it is hard to value it since you mostly compare yourself to.... yourself. You need to justify it properly before claiming these kind of affirmations."

Dear reviewer,
Unfortunately you are having a "strange" feeling. I believe that this is mostly due to the fact that you are not very much aware of the recent academic literature and field practice on load forecasting. Maybe you should go to google "load forecasting", "electric load forecasting" or "energy forecasting", and see how my work shows up among the top three entries on Google's first page. THIS POST discusses my way of citing references. The papers on my reference list are carefully picked based on relevance and quality.The quality is mainly determined by whether the work is being used by the industry or not.  So far, my readers have been very pleased with the useful references I've listed on my papers. Oh, you might be pissed off by my not citing (enough) of your papers. In order for me to cite more of your papers, you should write more high quality papers to show how your work is being valued by the industry.

In my first submission, there were 25 references, of which 9 were my own papers. We carefully considered the reviewer's comments, and increased the number of references to 34 in the final submission, of which 12 papers were mine.

2. "All the models in the paper are derivatives of the Vanilla's Tao Benchmark. It has been shown that this model can be outperformed by a significant margin by state of the art models (see GEFCOM2012 results). Is it useful to use such models (and to finally improve it by max 9%) while GEFCOM2012 results show that some models can improve its forecast by almost 40%."

Dear reviewer,
Take another look at Table I please. That 5.21% were from the Vanilla model. The MAPE of model B4 without humidity is already down to 3.79%. Our proposed model is at 3.62%. This is more than 30% improvement over the Vanilla model. Here we did not even add holiday effect to the models. On the other hand, please take a look at this paper Weather Station Selection for Electric Load Forecasting. Are you wondering why the entire paper is based on the Vanilla model? Why didn't I even add recency effect? It is because the proposed methodology can also be applied to more complicated models. To avoid verbose presentation and distraction from the main theme of a paper, we can show the results on a benchmark model.

3. "It is well known that multicolinearity is very bad in MLR models and can lead to instability of parameters and false results. It would be nice to have an idea of estimated parameters for the different variables and models, and to exhibit significance results, tests, etc."

Dear reviewer,
Please read some papers in the load forecasting literature, and see how often people are using lagged variables (both load and temperatures). Maybe my recent IJF paper on recency effect can totally piss you off. Are you wondering why those papers are using these highly correlated variables? It is because we have so many observations in load forecasting. BTW, please do not show those significant tests, such as p-value, in your papers. They are useless in load forecasting. Again, we have so many observations that the residuals are rarely normally distributed. Moreover, those p-values are from in-sample fit, which tells nothing about the predictive power of your models. Furthermore, there are hundreds of parameters being estimating in a load forecasting model, how do you plan to show the significant tests of those variables? You may want to read Scott Armstrong's paper on Illusions in Regression Analysis to re-examine your understandings in regression analysis.

Citation

Jingrui Xie, Ying Chen, Tao Hong and Thomas D. Laing, "Relative humidity for load forecasting models", IEEE Transactions on Smart Grid, in press.

The working paper is available HERE.

Relative Humidity for Load Forecasting Models

Jingrui Xie, Ying Chen, Tao Hong and Thomas D. Laing

Abstract

Weather is a key driving factor of electricity demand. During the past five decades, temperature is the most commonly used weather variable in load forecasting models. Although humidity has been discussed in the load forecasting literature, it has not been studied as formally as temperature. Humidity is usually embedded in the form of Heat Index (HI) or Temperature-Humidity Index (THI). In this paper, we investigate how Relative Humidity (RH) affects electricity demand. From a real-world case study at a utility in North Carolina, we find that RH plays a vital role in driving electricity demand during the warm months (June to September). We then propose a systematic approach to including RH variables in a regression analysis framework, resulting in the recommendation of a group of RH variables. The proposed models with the recommended addition of RH variables improve the forecast accuracy of Tao’s Vanilla Benchmark Model and its three derivatives in one-day (24-hour) ahead, one-week ahead, one-month ahead and one-year ahead ex post forecasting settings, with the relative reduction in Mean Absolute Percentage Error (MAPE) ranging from 4% to 9% in this case study. It also outperforms two HI based models under the same settings.  Moreover, an extended test case also demonstrates the effectiveness of these RH variables on improving the Artificial Neural Network models.

Sunday, March 6, 2016

From High-resolution Data to High-resolution Probabilistic Load Forecasts

One of the contributions of my TSG2014 paper is to show that hourly data helps generate more accurate long term forecasts than those from daily or monthly data. While we showed the improvement in point load forecast accuracy, we did not formally compare probabilistic forecast accuracy. This conference paper completed that missing comparison. We will present the paper at the IEEE PES T&D conference this May. The working paper is available HERE.

Citation
Jingrui Xie; Tao Hong and Chongqing Kang "From high-resolution data to high-resolution probabilistic load forecasts", 2016 IEEE PES Transmission and Distribution Conference and Exposition, Dallas, TX, May 2-5, 2016

From High-resolution Data to High-resolution Probabilistic Load Forecasts

Jingrui Xie, Tao Hong and Chongqing Kang

Abstract

Long term load forecasting plays a vital role in power systems planning and utility financial planning. Traditional methods in long term load forecasting rely on monthly data, which offers limited observations to support the comprehensive models with sufficient explanatory variables to capture the salient features in the electricity demand series. The grid modernization efforts undertaken by many utilities over the past decade have made high-resolution data available for many analytical tasks including load forecasting. In this paper, we investigate the effectiveness of using high-resolution data in long term probabilistic load forecasting. The primary error measure we use for forecast evaluation is pinball loss function. Through a case study based on the data from a U.S. utility, we show that high-resolution data is beneficial to the improvement of probabilistic load forecasts.

Monday, February 8, 2016

Analytics, Smart Grid and Big Data: Are They Like Teenage Sex?

I can hardly find the original source for this quote about teenage sex:
Everyone talks about it, nobody really knows how to do it, everyone thinks everyone else is doing it, so everyone claims they are doing it.
Over the past few decades, people have been inventing, abusing, reinventing and re-abusing various buzzwords. The title of this blog post is taken from a talk I gave last year.

In that talk, I was showing the audience how the public interest on these three terms has been evolving over time. For instance, "smart grid" on Google Trends look like this:

I also introduced my understanding of big data analytics using a series of research projects on load forecasting with NCEMC. At the end, I was making three points:
  • Forget about the buzzwords
  • Focus on what the industry needs
  • Solve real-world problems
The original presentation is available HERE, in case you are interested in taking a look.

p.s., when naming my lab two years ago, I almost used all of these three terms, analytics, smart grid and big data. Because I didn't really understand what smart grid is, I put "energy" instead of "smart grid" in my lab's name, making it BigDEAL - Big Data Energy Analytics Laboratory

Friday, February 27, 2015

Electric Load Forecasting with Recency Effect: a Big Data Approach

When I first wrote the CFP for the special issue on Analytics for Energy Forecasting with Applications to Smart Grid in 2012, I used the term big data, with a quotation mark. Nowadays, big data is no longer new to the utility industry. In fact the utilities have been working with big data since it was called just "data" - we witness the growth of data to big data in this smart grid era. To collect the most recent progress and advancements in big data analytics, we just issued another CFP for the special issue on Big Data Analytics for Grid Modernization.
What is big data analytics, deep learning, high-performance computing and petabyte size? 
I have three simple criteria:
  1. The data size is larger than what typical data analysis tools can handle. If you are using MS Excel to do some data analysis, then a data file with 1.1 million rows is big data. 
  2. The computing time is longer than the analysis time. Let's say it takes you a few days to think of a design of an algorithm. If testing the algorithm takes a few weeks, then it is big data. 
  3. The problem requires analysis at a higher level of granularity than usual. If your typical load forecasting process rely on monthly data, moving to daily or hourly data may bring you the big data challenge. 
Although these three criteria do not have to be met at the same time to qualify big data analytics, they are indeed connected to each other. Analyzing high resolution data often requires advanced data analysis tools and significant computing time. 

This paper has big data in its title, because it covers the latter two criteria. The regression models we developed in this paper contain up to thousands of variables, which require significant amount of time for parameter estimation, much longer than our thought process. Moreover, we customized the models based on each zone of a geographic hierarchy and each node (hour) of the temporal hierarchy. Of course the forecasting errors are reduced with our proposed approach, which also tells us the importance of powerful computers in load forecasting. 

The case study is based on the GEFCom2012 data published in my 2014 IJF paper Global Energy Forecasting Competition 2012. We compared the results with those in my 2015 IJF paper Weather Station Selection for Electric Load Forecasting.

Citation
Pu Wang, Bidong Liu and Tao Hong, "Electric load forecasting with recency effect: a big data approach", International Journal of Forecasting, vol.32, no.3, pp 585-597, July-September, 2016. Working paper available online http://www.drhongtao.com/articles


Electric Load Forecasting with Recency Effect: a Big Data Approach

Pu Wang, Bidong Liu and Tao Hong

Abstract

Temperature plays a key role in driving electricity demand. We adopt "recency effect", a term originated from psychology, to illustrate the fact that electricity demand is affected by the temperatures of preceding hours. In the load forecasting literature, the temperature variables are often constructed in the form of lagged hourly temperatures and moving average temperatures. Over the past decades, computing power has been limiting the amount of temperature variables that can be used in a load forecasting model. In this paper, we present a comprehensive study on modeling recency effect through a big data approach. We take advantage of the modern computing power to answer a fundamental question: how many lagged hourly temperatures and/or moving average temperatures are needed in a regression model to fully capture recency effect without compromising the forecasting accuracy? Using the case study based on data from the load forecasting track of the Global Energy Forecasting Competition 2012, we first demonstrate that a model with recency effect outperforms its counterpart in forecasting individual load series at aggregated level by 18% to 20%. We then apply recency effect modeling to customize load forecasting models at low level of a geographic hierarchy, again showing the superiority over a benchmark model by 13% to 15% on average. Finally, we discuss four different implementations of the recency effect modeling by hour of a day. 

Thursday, December 25, 2014

Call For Papers: Big Data Analytics for Grid Modernization | IEEE Transactions on Smart Grid

IEEE Transactions on Smart Grid

Special Issue on Big Data Analytics for Grid Modernization

Advanced analytics is playing a vital role in the age of big data, such as managing smart cities, predicting crime activities, optimizing medicine formula based on genetic defects, detecting financial frauds, and personalizing marketing campaigns. Many industries are taking advantage of the big data after years of research and development. With the increasing deployment of new metering and monitoring devices such as phasor measurement units (PMUs) and smart meters, the electric utilities are collecting a large variety of data at an unprecedented granularity and volume.  So the optimal management and utilization large amounts of collected data become a huge challenge in utilities’ operations and planning. This special issue aims to publish original research papers and visionary reviews on the technologies, algorithms and case studies associated with big data analytics for smart grid applications and modernizing the electric power grid.

Wednesday, September 24, 2014

Weather Station Selection for Electric Load Forecasting

In the load forecasting literature, most papers are focusing on the direct application of some techniques, such as regression, ARIMA, ANN, etc. Not many papers are discussing original methodologies that can be used across different techniques. The investigation on new sub-problems of load forecasting is even rare. Weather station selection is a necessary step in load forecasting, but has never been formally studied in the past many decades. We wrote this paper last year to describe how to apply a greedy method and out-of-sample test to select weather stations. Although regression models are used here, our methodology is independent of the techniques as long as they rely on weather variables.

The paper was accepted by International Journal of Forecasting this summer. The working paper is available HERE. I will update the citation once the paper is on Science Direct.

Citation
Tao Hong, Pu Wang and Laura White, "Weather station selection for electric load forecasting", International Journal of Forecasting, vol.31, no.2, pp 286-295, April-June, 2015, working paper available from http://www.drhongtao.com/articles.

Weather Station Selection for Electric Load Forecasting

Tao Hong, Pu Wang and Laura White

Abstract

Weather is a major driving factor of electricity demand. Selection of weather station(s) plays a vital role in electric load forecasting. Nevertheless, minimal research efforts have been devoted to weather station selection. In the smart grid era, hierarchical load forecasting, which provides load forecasts throughout the utility system hierarchy, is becoming an emerging and important topic. Since there are many nodes to forecast in the hierarchy, it is no longer feasible for forecasting analysts to manually figure out the best weather stations for each node. A commonly used solution framework is to assign the same number of weather stations to all nodes at the same level of the hierarchy. This framework was also adopted by all of the four winning teams of Global Energy Forecasting Competition 2012 (GEFCom2012) in the hierarchical load forecasting track. In this paper, we propose a weather station selection framework to determine how many and which weather stations to use for a territory of interest. We also present a practical, transparent and reproducible implementation of the proposed framework. We demonstrate the application of the proposed approach to forecasting electricity at different levels in the hierarchies of two US utilities respectively. One of them is a large US generation and transmission cooperative that has deployed the proposed framework. The other one is from GEFCom2012. In both case studies, we compare our unconstrained approach with four other alternatives based on the common practice mentioned above. We show that the forecasting accuracy can be improved by releasing the constraint on the fixed number of weather stations.