It is December now. Those of us who live in the North Hemisphere have officially stepped into the winter season. So far this winter in North Carolina seems to be warmer than the last couple of years. Although I can't predict how severe or warm this winter will be, I think it is a good time to write this blog post about the magic ruler.
Last week in Nashville, I was teaching my new course on long term load forecasting for the first time. I introduced several classical methods, of which the first one is "the magic ruler". Basically, we can put a ruler on a line plot of the historical annual peaks to capture the trend and predict the future annual peaks (see Figure 1).
Well, an emerging need today is probabilistic load forecast. By applying that ruler twice, we can also predict both the upper and lower bounds of the annual peaks (see Figure 2).
In fact, this ruler is just a realization of our mental shortcuts, or so-called heuristics. A simple one is recency effect - we human beings tend to remember the most recent things. Moreover, we tend to give too much weight to the most recent extreme events when making decisions. For example, If one winter is very cold, and the following winter is also very cold, we tend to believe that the third winter must be very cold too.
In load forecasting, the above example can be translated to:
I'm going to show you how to use these two rulers (or models) to forecast the annual peak for ISO New England. All of their data is publicly available, I'm pulling the annual peaks from 1993 to 2014. Figure 3 shows the actual annual peaks along with the forecasts of the most 20 years from two models.
Here are some error statistics:
In the above example, I'm using the two models for one-year ahead annual peak forecasting on rolling basis for 20 years. In the language of forecasting, this is called sliding simulation, a powerful tool for forecasters.
Poor accuracy is just one of the drawbacks of the magic ruler. Another weakness is that the ruler can hardly answer your what-if questions, such as what the load will look like if next year is hot/cold. It does not offer any insights either, such as how economy growth is driving the load growth.
Hopefully now you know why I don't rely on these rulers. If you still want to critique and adjust your analyst's forecast, I would suggest that you document your adjustment every year. After 5 or 10 years, you can look back and see whose forecast is more accurate.
Last week in Nashville, I was teaching my new course on long term load forecasting for the first time. I introduced several classical methods, of which the first one is "the magic ruler". Basically, we can put a ruler on a line plot of the historical annual peaks to capture the trend and predict the future annual peaks (see Figure 1).
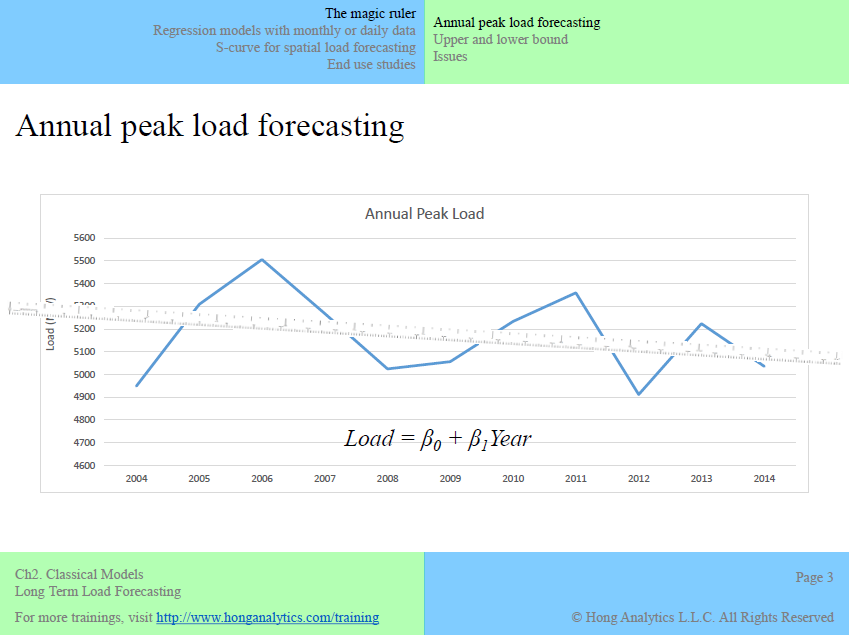 |
| Figure 1. Forecasting annual peak load with one ruler. |
Well, an emerging need today is probabilistic load forecast. By applying that ruler twice, we can also predict both the upper and lower bounds of the annual peaks (see Figure 2).
 |
| Figure 2. Forecasting upper and lower bounds of annual peak load. |
In fact, this ruler is just a realization of our mental shortcuts, or so-called heuristics. A simple one is recency effect - we human beings tend to remember the most recent things. Moreover, we tend to give too much weight to the most recent extreme events when making decisions. For example, If one winter is very cold, and the following winter is also very cold, we tend to believe that the third winter must be very cold too.
In load forecasting, the above example can be translated to:
- If the previous year set a record-high peak, and this year set another record-high peak, then we must prepare for an even higher peak next year. In the language of forecasting, this method is called linear extrapolation using the most recent observations. The model is a simple linear regression model estimated with the most recent two observations in the history. Let's say this is Ruler #1 or R1.
- If the load forecast is set to be the same as the annual peak of the most recent year, then the method is called persistence. The model is a random walk without drift model. Let's say this is Ruler #2 or R2.
I'm going to show you how to use these two rulers (or models) to forecast the annual peak for ISO New England. All of their data is publicly available, I'm pulling the annual peaks from 1993 to 2014. Figure 3 shows the actual annual peaks along with the forecasts of the most 20 years from two models.
 |
| Figure 3. Actual peak and forecasts from the two rulers. |
Here are some error statistics:
- The errors from R1 range from -4,435MW (or -18%) to 3,669MW (or 14%), with the mean absolute percentage error (MAPE) of 7.92%.
- The errors from R2 range from -2,936MW (or -12%) to 3,067MW (or 12%), with the MAPE of 5.09%.
In the above example, I'm using the two models for one-year ahead annual peak forecasting on rolling basis for 20 years. In the language of forecasting, this is called sliding simulation, a powerful tool for forecasters.
Poor accuracy is just one of the drawbacks of the magic ruler. Another weakness is that the ruler can hardly answer your what-if questions, such as what the load will look like if next year is hot/cold. It does not offer any insights either, such as how economy growth is driving the load growth.
Hopefully now you know why I don't rely on these rulers. If you still want to critique and adjust your analyst's forecast, I would suggest that you document your adjustment every year. After 5 or 10 years, you can look back and see whose forecast is more accurate.
No comments:
Post a Comment
Note that you may link to your LinkedIn profile if you choose Name/URL option.